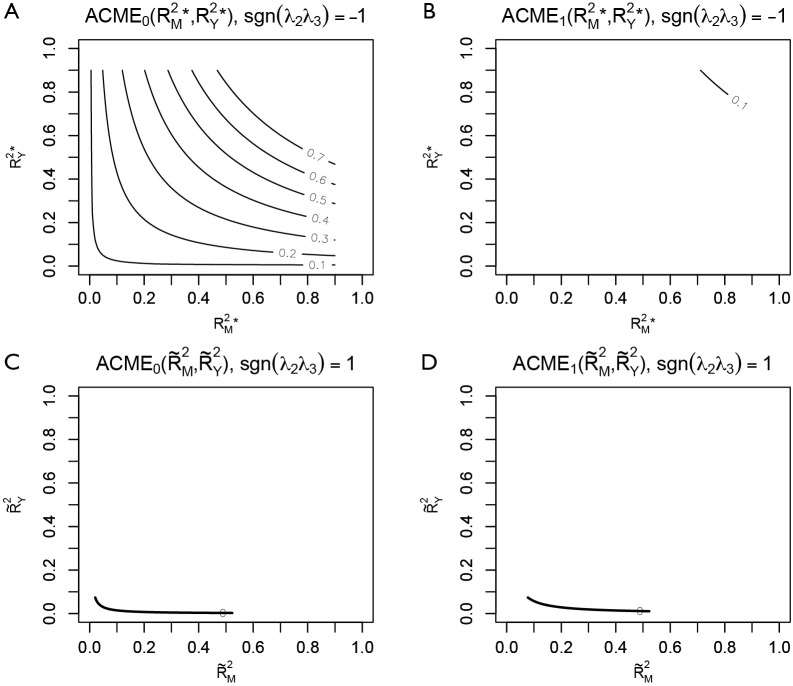
Figure 4.
Sensitivity analysis based on coefficient of determination. Four plots are produced by varying r.type and sign.prod arguments within plot() function. Note that only the first plot that has displayed a series of ACME values. Each of the other plots has displayed the contour of one ACME value, because the native R contour function automatically adjusts the displaying values.

