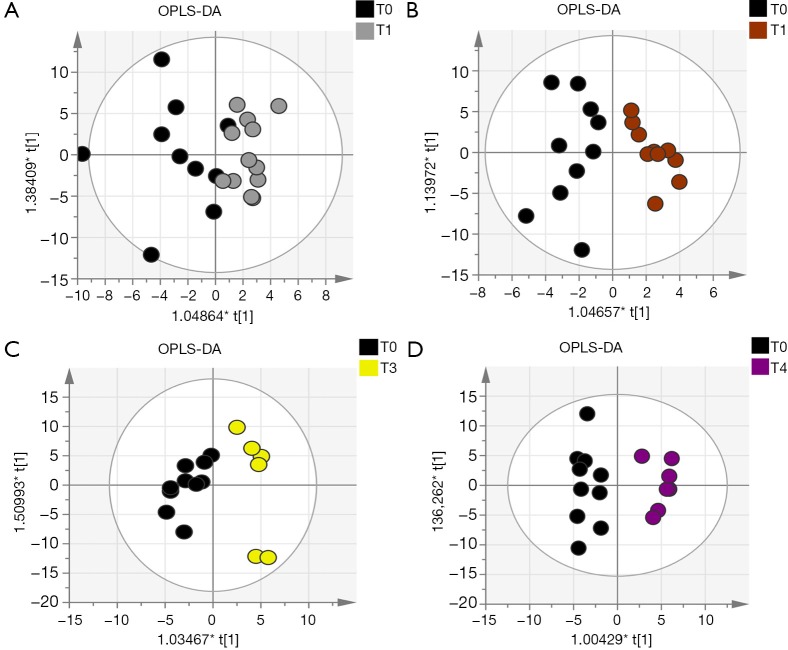
Figure 3.
OPLS-DA of urine metabolic profile in perinatal asphyxia. Scores plot of the comparison of urine samples at birth before starting TH (T0, black dots) with: urine samples after 24 hours from birth, during TH (T1, gray dots, A); urine samples after 72 hours from birth, at the end of TH (T2, brown dots, B); urine samples after 1 week from birth (T3, yellow dots, C); urine samples after one month from birth (T4, purple dots, D). The X axes is the weighted score component t[1] whereas the Y axes is the orthogonal weighted score component t[1]. OPLS-DA, orthogonal partial least squares-discriminant analysis; TH, therapeutic hypothermia.

