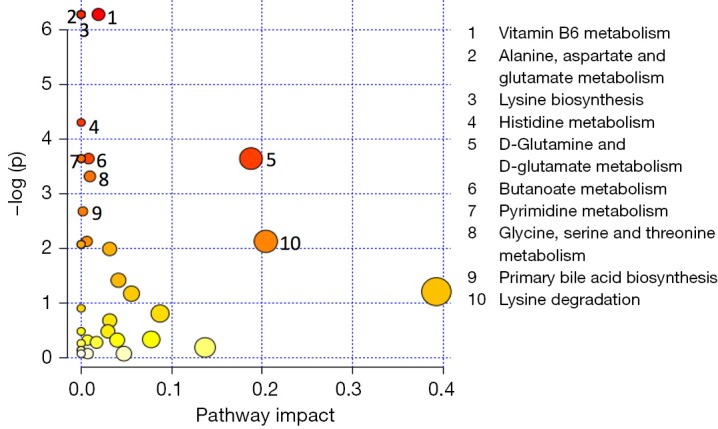
Figure 7.

Metabolic pathway analysis after 1 month of life. Metabolic pathways are represented as circles according to their scores from enrichment (vertical axis) and topology analyses (pathway impact, horizontal axis). Darker circle colors indicate more significant changes of metabolites in the corresponding pathway. The size of the circle corresponds to the pathway impact score and is correlated with the centrality of the involved metabolites. A list of ranked pathways 1–10 based on their relevance to the given traits is reported on the left; corresponding numbers have been associated with symbols in the plot.
