
Figure 4.
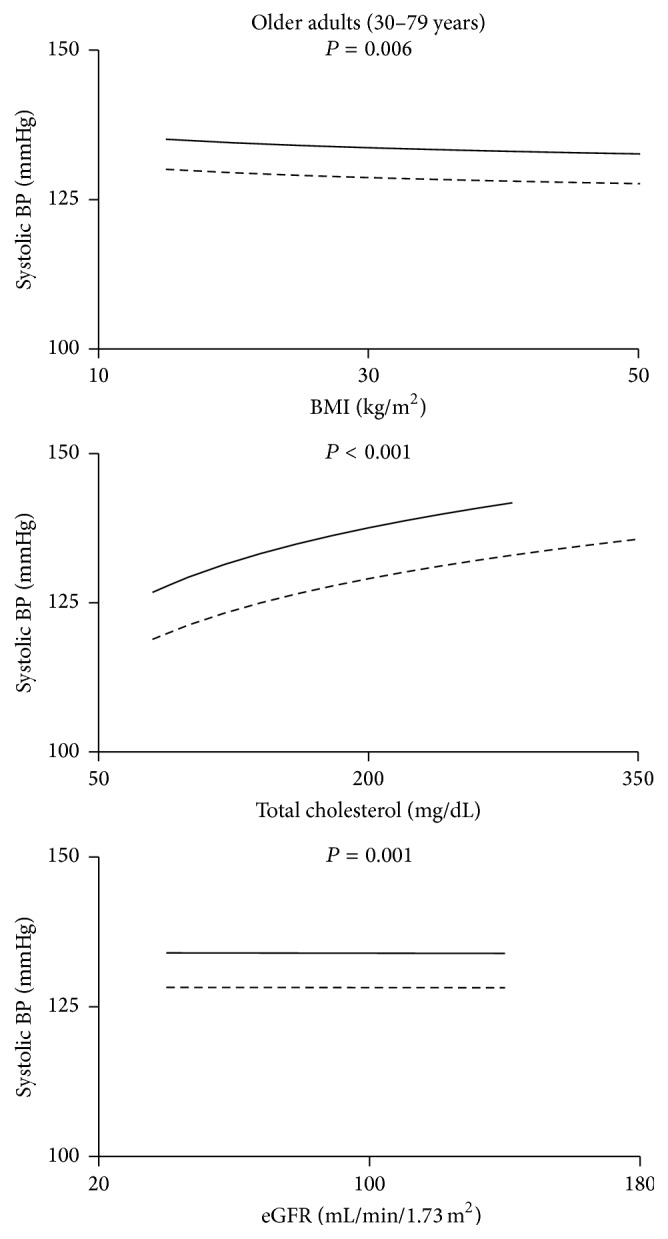
Systolic blood pressure for subjects treated with antihypertensive medications as a function of BMI, cholesterol, and estimated glomerular filtration rate (eGFR). The solid lines are the regression lines for PWH while the broken lines are for NHANES subjects. The P value for the difference between PWH and NHANES is shown.