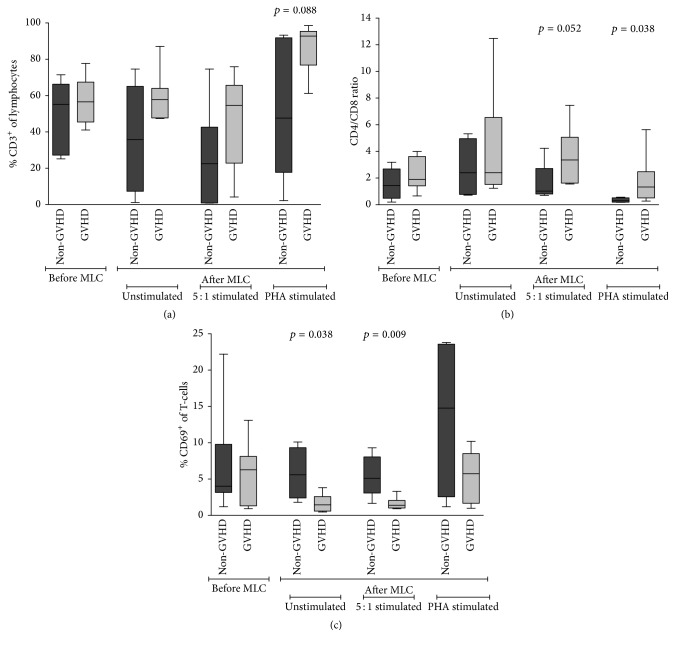
Figure 3.
The GVHD group showed dissimilarity in CD4/CD8 T-cell ratios and frequencies of CD69+ T-cells when responding donor cells were analysed after MLC. Flow cytometric analysis of responder cells (of donor origin) before and after MLC. Statistical analysis was done with the Mann–Whitney U test. (a) Frequencies of T-cells before and after MLC. T-cell frequencies did not differ between the non-GVHD and GVHD groups. (b) CD4/CD8 T-cell ratios before and after MLC. The CD4/CD8 T-cell ratio was similar between the two patient groups before MLC. After MLC, the CD4/CD8 ratio shifted towards an increase of CD4+ T-cells and a decrease of CD8+ T-cells in the GVHD group. (c) Frequencies of CD69+ T-cells before and after MLC. CD69 was expressed more on T-cells of non-GVHD patients after MLC for the unstimulated and 5 : 1 stimulated condition.

