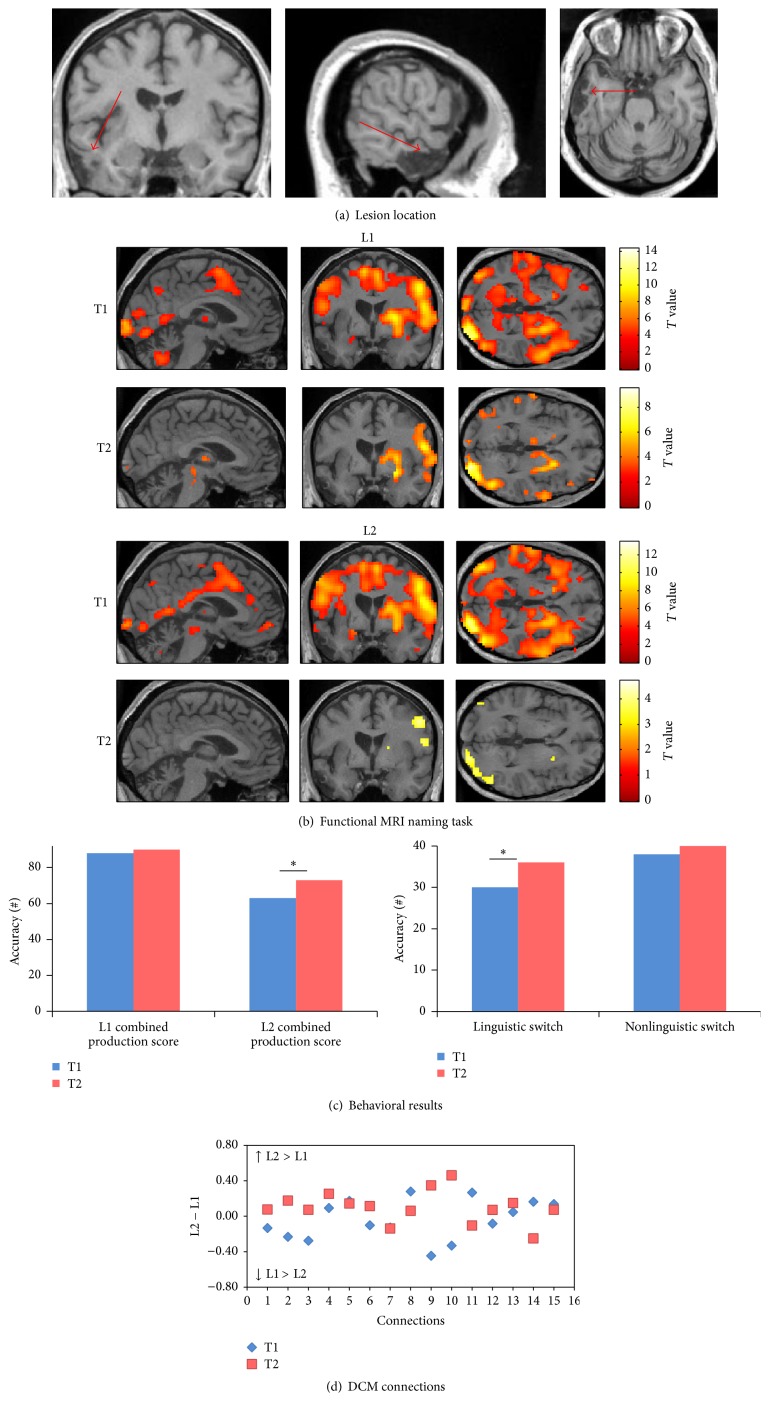
Figure 6.
Patient 4. (a) The T1-weighted MRI image at T1 shows a left sylvian ischemic stroke. (b) Pattern of brain activation in different conditions while picture naming, with an uncorrected p < 0.001 for the main effects. (c) Behavioral results of the combined production scores in both languages, linguistic and nonlinguistic switching scores across sessions. ∗ represents p value < 0.05. (d) Differences between L1 strength values and L2 strength values for each single connection across sessions. (1) ACC to LIFGTri. (2) ACC to LIFGOrb. (3) ACC to LC. (4) LC to ACC. (5) LC to LIFGTri. (6) LC to LIFGOrb. (7) LIFGTri to LC. (8) LIFGTri to ACC. (9) LIFGOrb to LC. (10) LIFGOrb to ACC. (11) LIFGTri to LIFGOrb. (12) LIFGOrb to LIFGTri. (13) BTLA to LIFGTri. (14) BTLA to LIFGOrb. (15) BTLA to LC.

