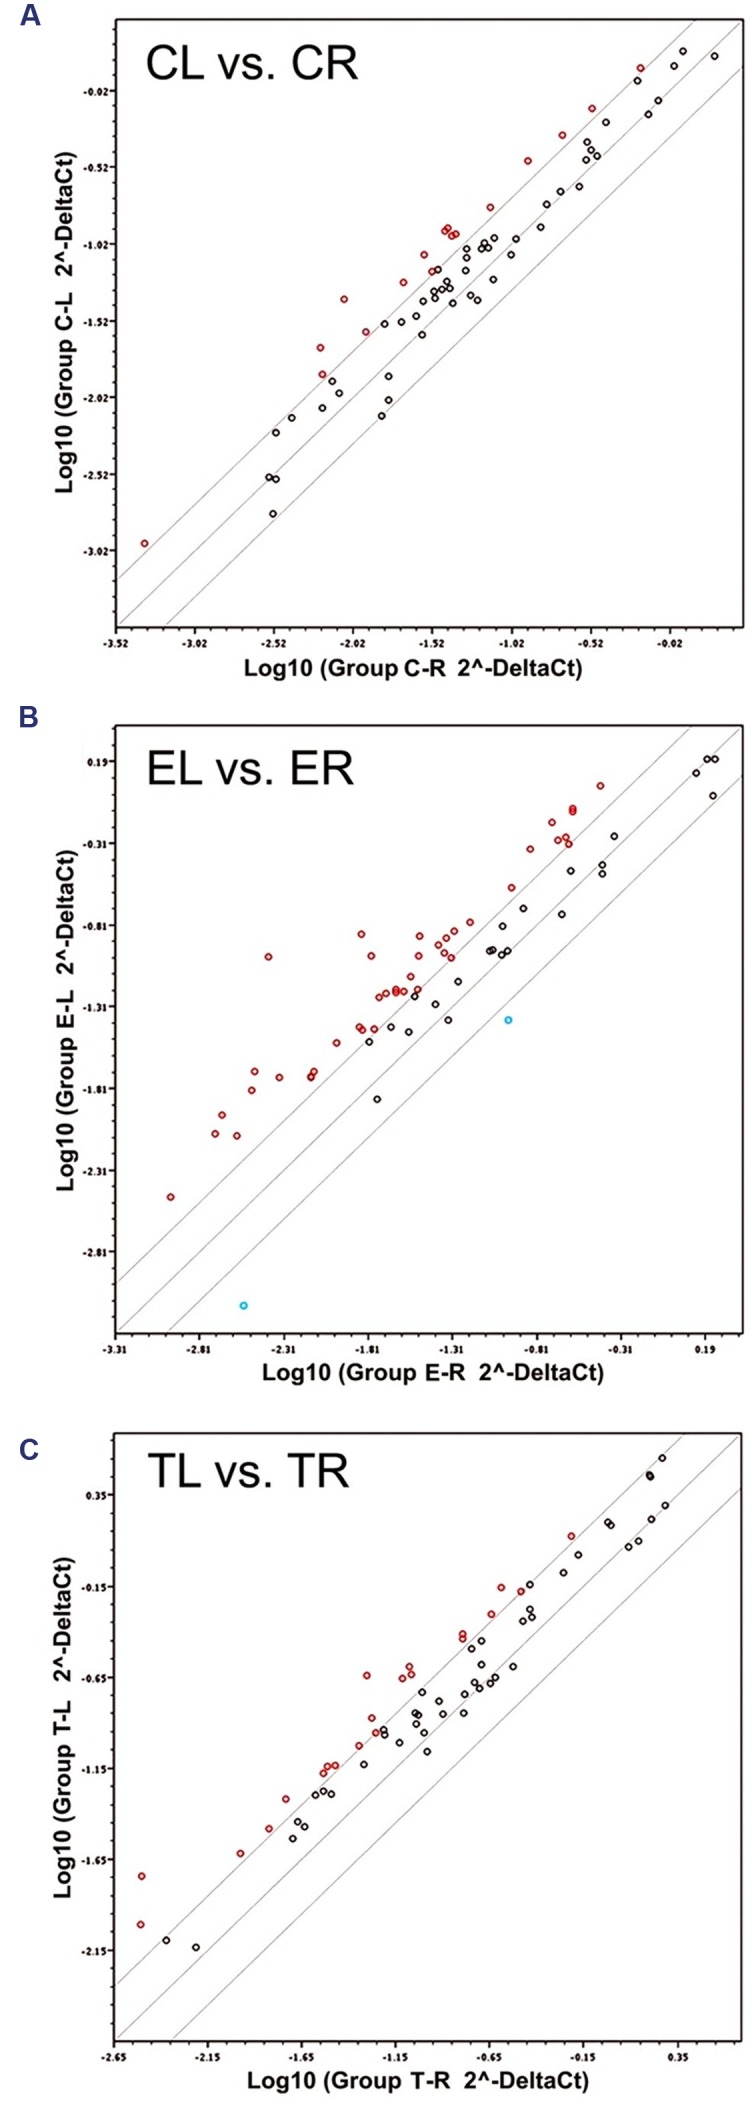
FIGURE 1.

Scatter plots of the 66 target mRNAs expression in trigeminal ganglia (TG). The expression profile is plotted as log10 (2ˆ-Delta Ct) in the left and right TG for the Control (A), Enriched (B), and Trimmed (C) groups. Values on the diagonal midline represent equal expression in both sides. Lines above and below the midline indicate the twofold cut-off boundaries of expression; colored circles above (red) and below (blue) these lines identify over- and under-expressed genes, respectively.
