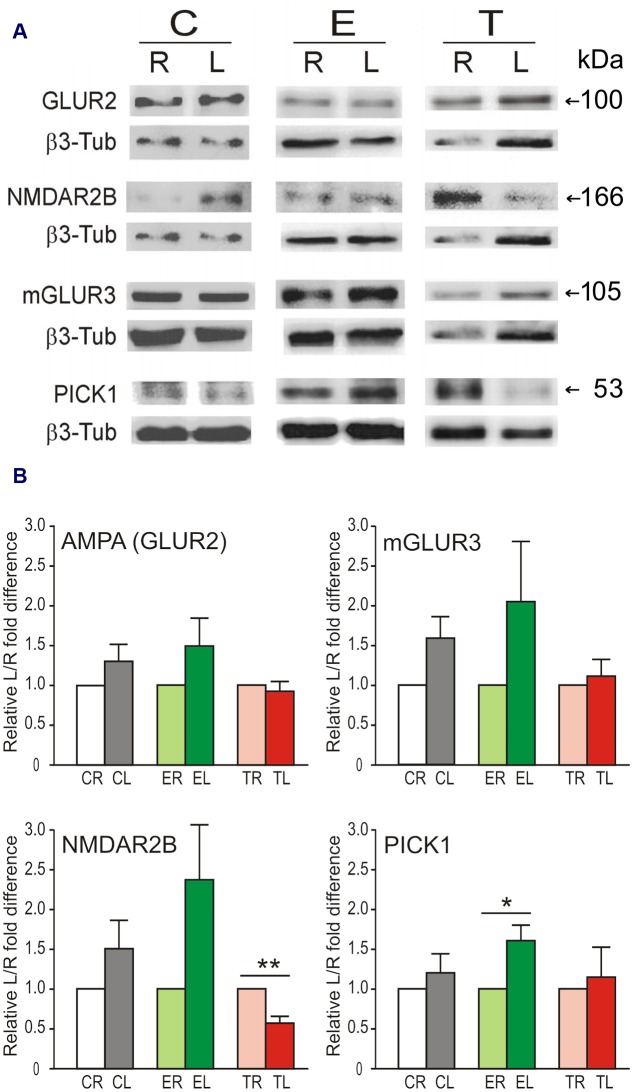
FIGURE 3.
Lateral differences in protein levels in the TG. (A) Representative immunoblots showing protein levels of GLUR2, NMDAR2B, mGLUR3, and PICK1 in left (L) and right (R) sides of the TG in the same animal from Control, Enriched, and Trimmed groups. β3-tubulin was used as loading control. (B) Variation in protein expression level is given taking the right side as 100%. Left over right side differences in protein levels of GLUR2, NMDAR2B, mGLUR3, and PICK1 in the TG. Error bars indicate SEM. ∗p < 0.05, ∗∗p < 0.01 compared with relative control groups; student’s paired two-tailed t-test.

