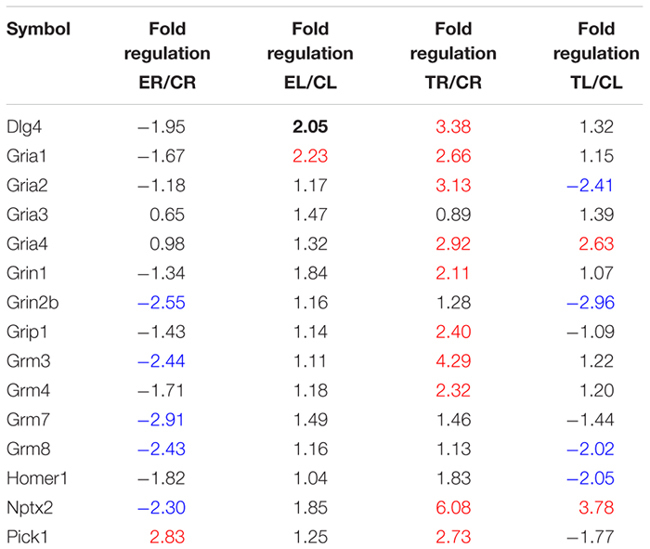
Table 2.
List of glutamate transmission-related genes studied in the array.
 |
The four columns show fold differences in expression for each side between groups, using the control group as the reference. Values in red and blue highlight ≥2-fold up or down changes in the expression ratio, respectively.
