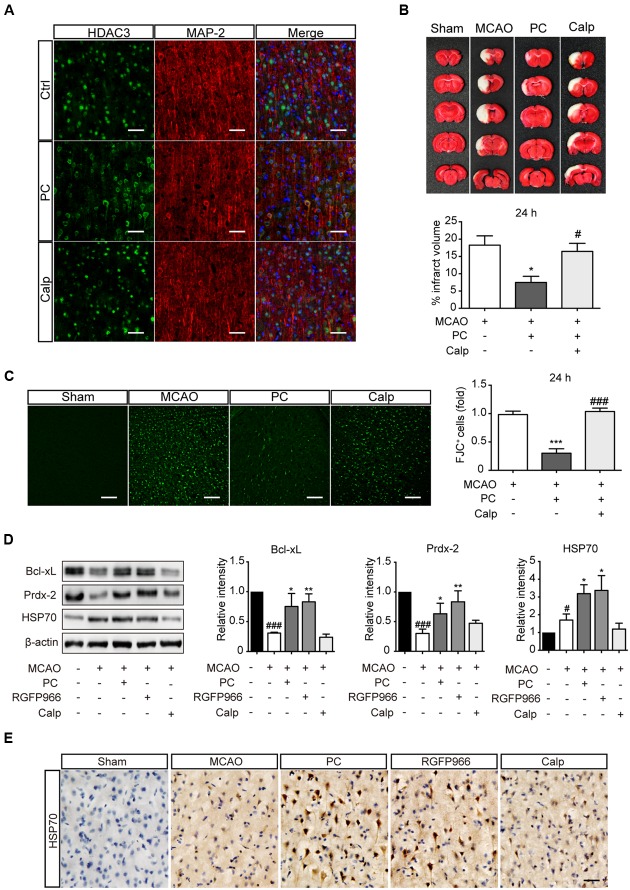
FIGURE 5.
Calpeptin pretreatment blocked the protective effect of PC in vivo. (A) Representative images of HDAC3 subcellular localization in cortex. Scale bar: 50 μm. (B) Representative images of TTC staining from each group are shown. Infarct volume percentage from each slice were determined (n = 8–10). ∗p < 0.05 versus MCAO group, #p < 0.05 versus PC group, ANOVA. (C) Representative images of Fluoro-Jade C staining and the numbers of degenerating neurons (over 30 slices from six rats per group). ∗∗∗p < 0.001 versus MCAO group, ###p < 0.001 versus PC group, ANOVA. (D) Expression levels of Prdx-2, Bcl-xL and HSP70 in each group (n = 3–4) 24 h after MCAO. #p < 0.05, ###p < 0.001 versus Sham group; ∗p < 0.05, ∗∗p < 0.01 versus MCAO group, ANOVA. (E) Representative images of Cerebral HSP70 immunohistochemistry. Scale bar: 50 μm. Calp, calpeptin.

