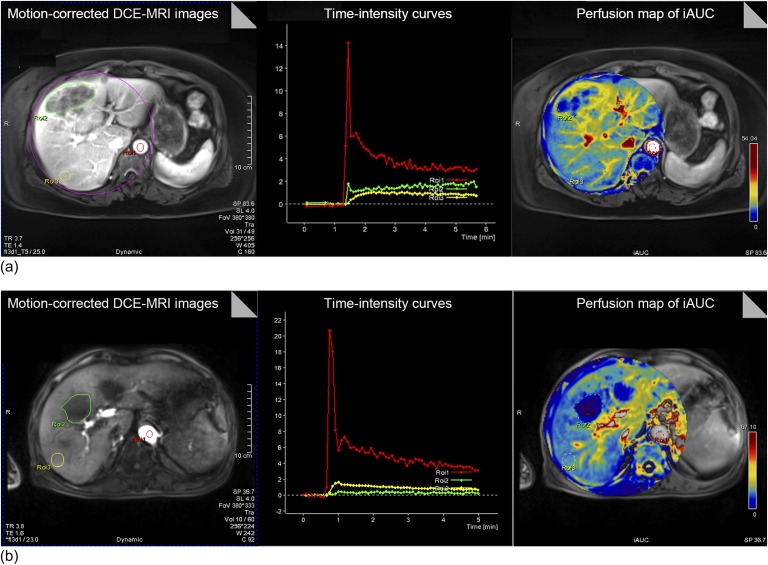
Figure 1.
Generation of perfusion maps and time–intensity curve from dynamic contrast-enhanced (DCE)-MRI using radial-volumetric interpolated breath-hold examination (VIBE) with k-space-weighted image contrast reconstruction (a) and controlled aliasing in parallel imaging results in higher acceleration with VIBE (b). In each sequence, DCE-MRI scans are registered to yield motion-corrected images (left). Regions of interests (ROIs) are placed in the aorta, tumour and liver parenchyma. From motion-corrected DCE-MRI scans, time–intensity curves of the ROIs are generated (middle). Then, perfusion maps of the initial area under the concentration curve (iAUC) are created (right). FOV, field of view; TE, echo time; TR, repetition time.

