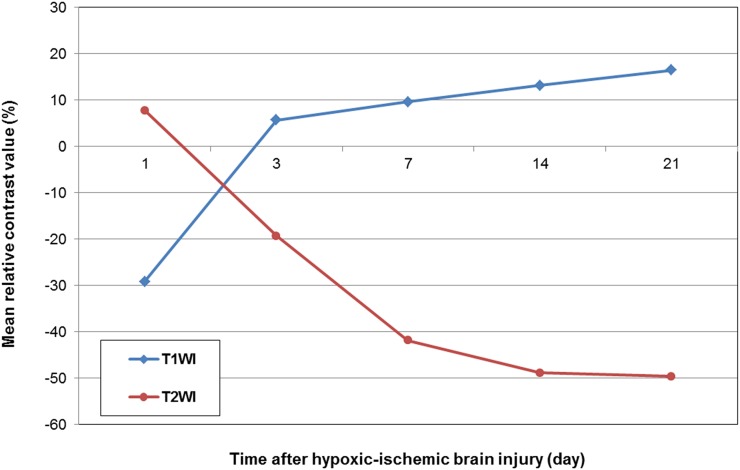
Figure 2.
Mean relative contrast values in the dorsolateral thalamus at each time point are showing an increase from a negative value at 1 day to 16.5 ± 4.8% at 21 days on T1 weighted images (T1WI) and a decrease from a positive value at 1 day to −49.6 ± 12.2% at 21 days on T2 weighted images (T2WI).

