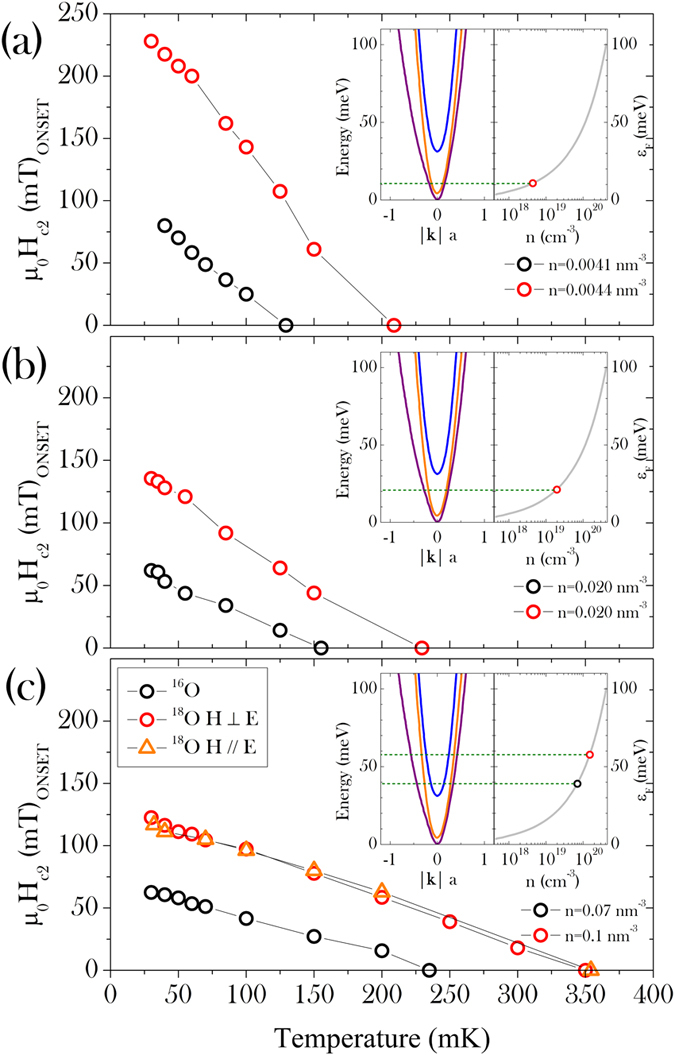
Figure 2. Upper critical field as a function of temperature at various doping levels.

Black symbols: SrTi16O3−y; red symbols: 18O-substituted SrTiO3−y. Panels (a–c) refer to charge carrier densities n ~ 0.004, 0.02, 0.07 nm−3, respectively. Open orange triangles and red circles in panel (c) indicate the Hc2 values measured with two mutually perpendicular directions of the applied magnetic field, both being perpendicular to the flowing current. Insets: detail of the conduction bands of SrTiO3 and Fermi energy at each doping level9.
