
Figure 4. FIR spectroscopy of the two back-substituted samples (red and black lines).
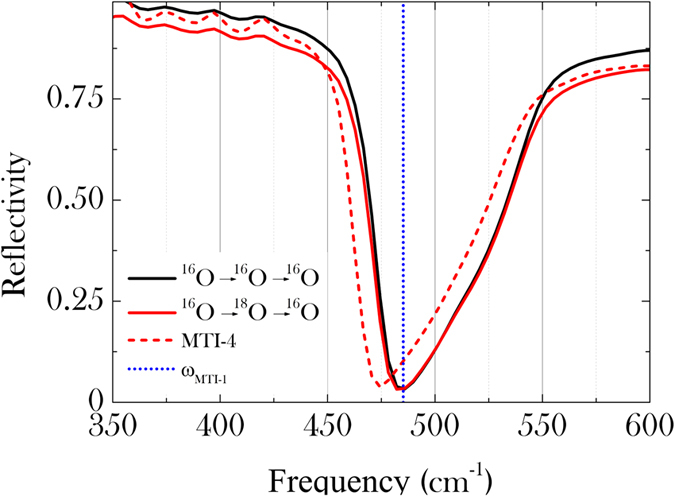
Red, respectively blue, dotted lines corresponding to the 18O substituted sample MTI-4, respectively to the phonon position of the pristine sample, are added as a reference for the phonon shift Tc vs. charge carrier density described in Fig. 1(e) with two supplementary points relative to the measurement of the samples back-substituted.