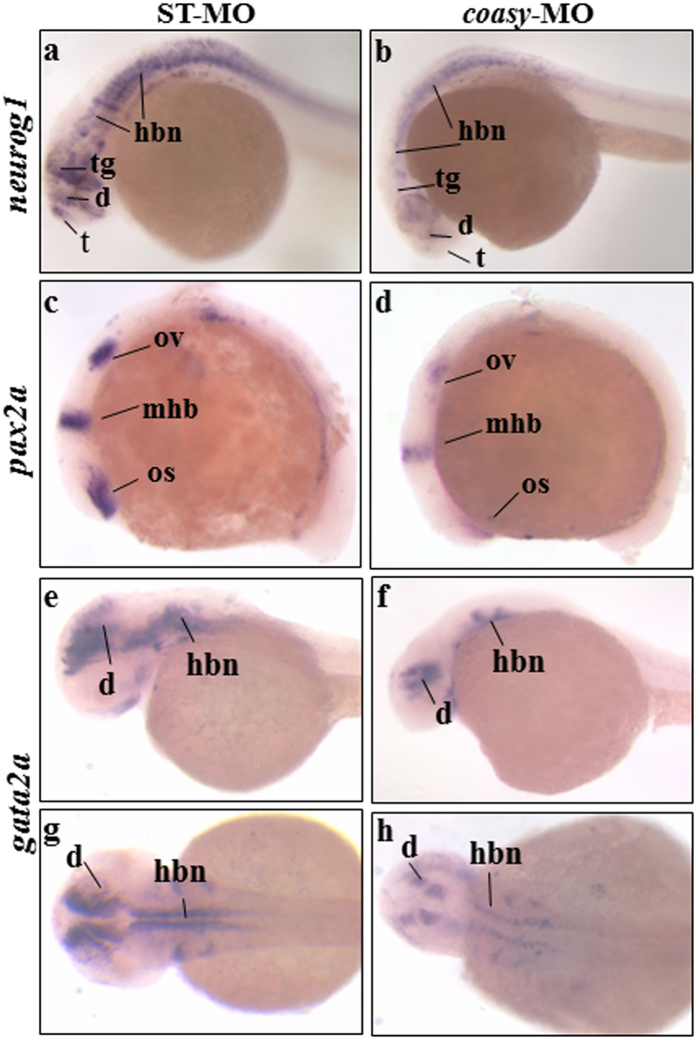
Figure 5. Analysis of neurog1, pax2a and gata2a neural markers in coasy morphants.
Representative images of WISH analyses with neurog1, pax2a and gata2a riboprobes. neurog1 in ST-MO- (a), and coasy-MO-injected embryos (b) at 24 hpf, lateral views. Pax2a expression in ST-MO- (c), and coasy-MO-injected embryos (d) at 15 hpf, lateral views. Gata2a expression in ST-MO- (e,f), and coasy-MO-injected embryos (g,h) at 17 hpf (e,f lateral views and g,h dorsal views). Results are from one representative experiment with at least 40 embryos out of two independent replicates. Abbreviations: d, diencephalon; hb, hindbrain; mhb, midbrain-hindbrain boundary; os optic stalk; ov, otic vesiscle; pd, pronephritic ducts.

