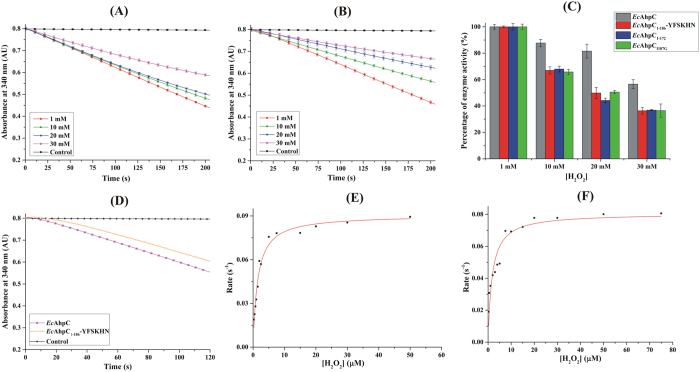
Figure 2. NADPH-dependent peroxidase activity of EcAhpC and EcAhpC1-186-YFSKHN.
Sensitivity of (A) EcAhpC and (B) EcAhpC1-186-YFSKHN to over-oxidation was determined by the measurement of NADPH oxidation at 1 mM (red), 10 mM (green), 20 mM (blue), and 30 mM H2O2 (magenta). The background oxidation without Prxs is shown as a control in black. The decrease in NADPH-oxidation with increasing concentrations of H2O2 is visible for both EcAhpC and EcAhpC1-186-YFSKHN. (C) Percentage of enzyme activity at each H2O2 concentration was calculated for WT EcAhpC and its mutants (Mean ± 1 SD) using the rate of NADPH oxidation at each concentration of H2O2. The rate of activity at the lowest concentration of H2O2 was taken as 100%. With increasing H2O2 concentrations, the percentage of enzyme activity decreased. (D) NAPDH oxidation of EcAhpC and EcAhpC1-186-YFSKHN measured at 30 μM H2O2 is shown as a representative for all other measurements done at various H2O2 concentrations to establish the enzyme kinetic parameters. Michaelis-Menten plot of (E) EcAhpC and (F) EcAhpC1-186-YFSKHN was done by fitting data of at least ten concentrations of H2O2.

