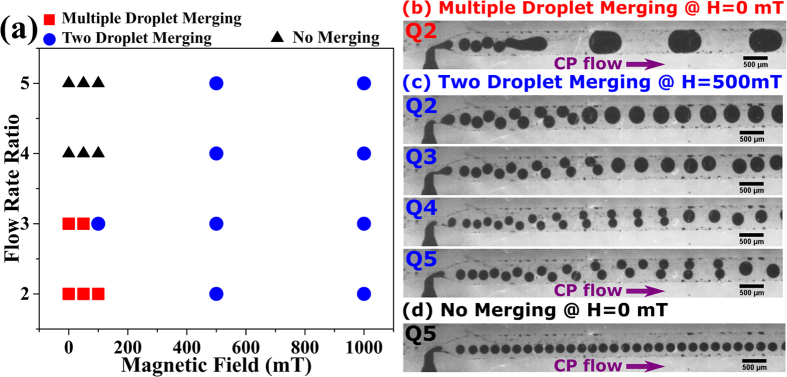
Figure 3.
(a) Droplet merging map depicting various droplet merging regimes. (b–d) Experimental micrographs (scale bar = 500 μm) for droplet merging regimes: (b) Multiple droplet merging (c) Two droplet merging (d) No merging. Q2, Q3, Q4 and Q5 denotes flow rate ratios. Please see Table 1 for ferrofluid properties and Table 2 for notation. The purple arrow indicates the direction of the CP flow (x-direction). The magnetic field is in the y-direction. A video S2 is available in the supplementary files, showing the experimental droplet merging regimes.

