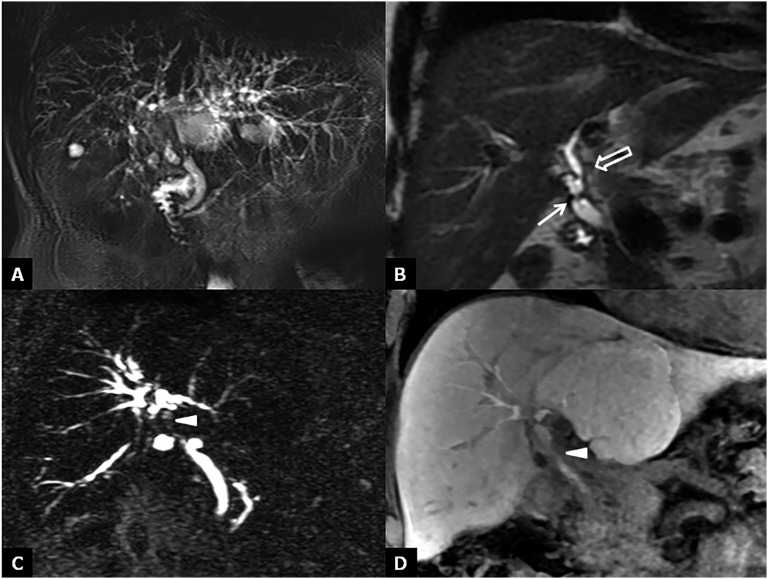
Figure 15.
Bile duct strictures. (a) Maximum intensity projections of three-dimensional (3D) thin-slab fast spin-echo T2 weighted image demonstrates the dilation and strictures of the intrahepatic biliary of both left and right lobes. (b) Coronal T2 weighted image shows intrahepatic (open arrow) and anastomotic (arrow) strictures. (c, d) Maximum intensity projections of 3D thin-slab fast spin-echo T2 weighted image and the corresponding T1 weighted MR cholangiography obtained after intravenous administration of a hepatobiliary contrast agent (gadoxetic acid) show an anastomotic stricture (arrowheads). To note that MR cholangiography tends to overestimate biliary stricture.

