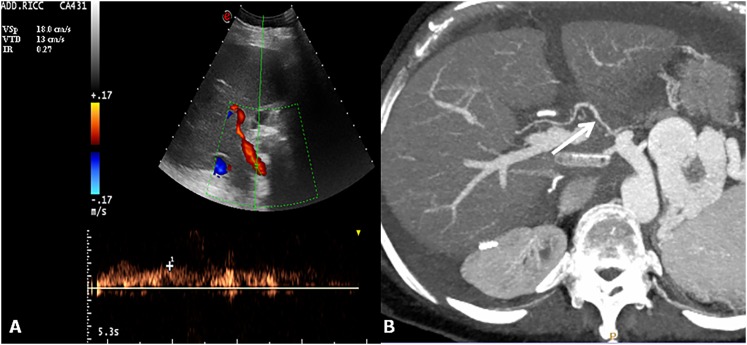
Figure 9.
Hepatic artery stenosis. Colour and spectral Doppler image of hepatic artery shows a tardus–parvus waveform with a prolonged acceleration time and decreased resistive index 0.27 (normal range, 0.5–0.8). Axial maximum intensity projection of the hepatic artery shows tiny calibre and irregular margins of the arterial vessel (arrow).

