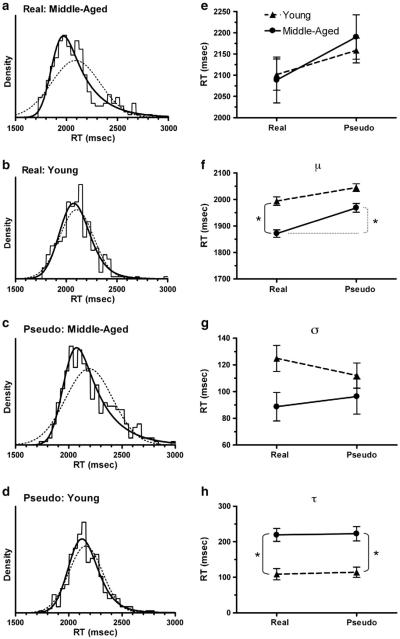
Fig. 1.
Distributions of RTs grouped by age and type of word. (a, b, c, d). The histograms were calculated with a bin width of 40 ms. The solid curve is the best fit of an ex-Gauss function, and the dotted curve is the best fit of a Gaussian function. (e) Mean RTs calculated by age and type of word. (f, g, h). Best-fit estimates of the parameters μ, σ, and τ for the ex-Gauss function fitted to the RT distributions shown in panels a–d. Each error bar is an estimate of the standard error of the parameter value, calculated from the Hessian matrix in QMPE/CML. Significant differences (Likelihood Ratio test, p < .0001) are marked by a bracket and asterisk.

