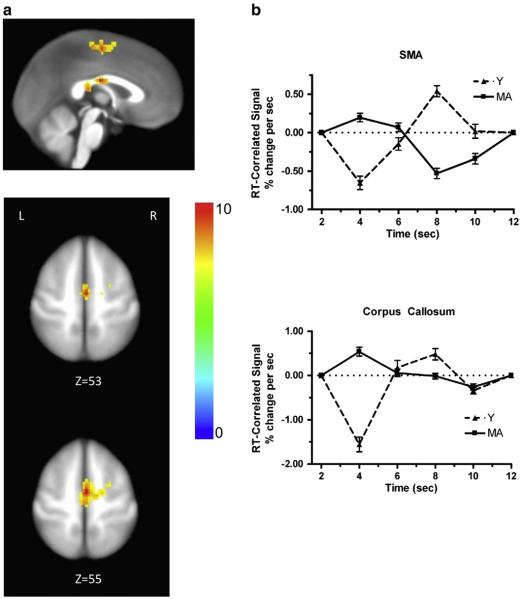
Fig. 3.
Brain activation associated with age by time interaction. (a) Activation in SMA and corpus callosum. The color bar codes for the F values. (b) Estimated time courses of the RT-correlated signal for each age group for SMA (upper panel) and corpus callosum (lower panel). The responses to real words and pseudowords were combined within each age group for this analysis.

