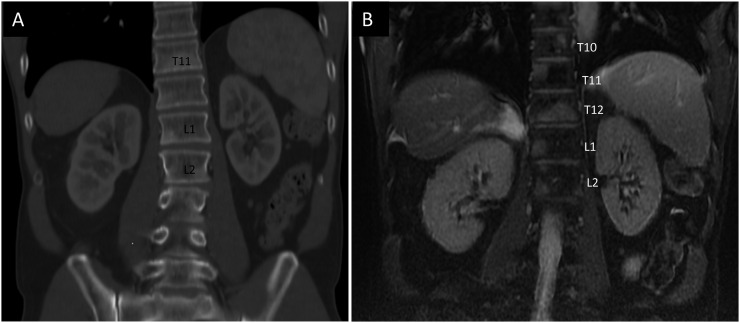
Figure 3.
(a) Coronal CT image demonstrating bony metastases seen as sclerotic densities in T11, L1 and L2 vertebral bodies. (b) Coronal MRI gradient echo, non-contrast, T2 weighted fat-suppressed sequence on the same day demonstrating several other bony metastases in vertebral bodies T10, T11, T12, L1 and L2.

