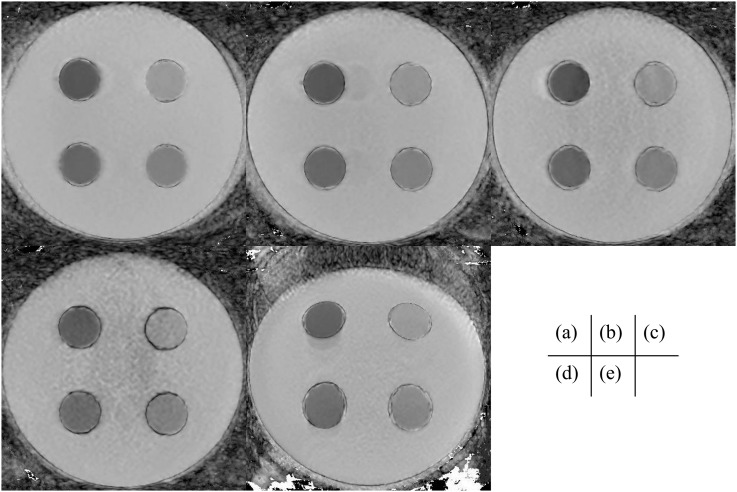
Figure 6.
The apparent diffusion coefficient (ADC) maps of AF = 1.0 (a), 2.0 (b), 3.0 (c) and 4.0 (d) and single-shot echo-planar imaging diffusion-weighted imaging (e) are shown. All ADC maps were calculated with the image of b = 0 and 1000 (mm2 s−1). The same window level and width were selected to compare images.

