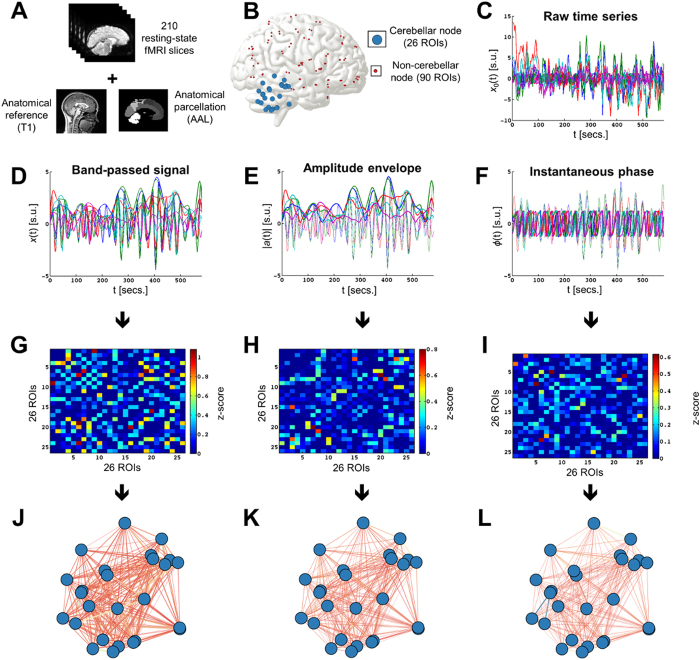
Figure 2. Schematic representation of the construction of three functional networks for one cerebellum.
(A) The 210 resting-state fMRI volumes (slices) are co-registered to the anatomical T1 3D reference volume, and each voxel is mapped to one of the 116 ROIs in the AAL atlas (including the cerebellum). (B) The anatomical atlas allows segmenting the brain into 90 cerebral and 26 cerebellar ROIs, and after artefact removal, a time series of the mean (BOLD) activation probability for each of the 116 ROIs is obtained. (C) For each ROI, a raw time series is retrieved using the 210 fMRI slices acquired through 9:56 minutes of scan. (D) A band-pass filter is applied to obtain the resting-state fMRI narrowband signal (0.04–0.07 Hz). (E) The amplitude envelope of each band-passed wave is estimated for later analysis. (F) Similarly, the Hilbert transform also allows calculating the instantaneous phase of the waves. (G–I) Three partial correlation matrices are obtained from the previous time-series (band-passed and Hilbert-transformed amplitude envelope and phase); they are z-transformed to normalize correlation values across individuals. Warm (cold) colours in these matrices represent large (small) correlation values between ROIs. The left tail of these correlation matrices (i.e., edges with negative z-scores) are set to 0 following a soft-thresholding procedure. (J–L) Graph-theoretical measures of edge weight are obtained for each pair of cerebellar regions, to be analyzed using NBS.

