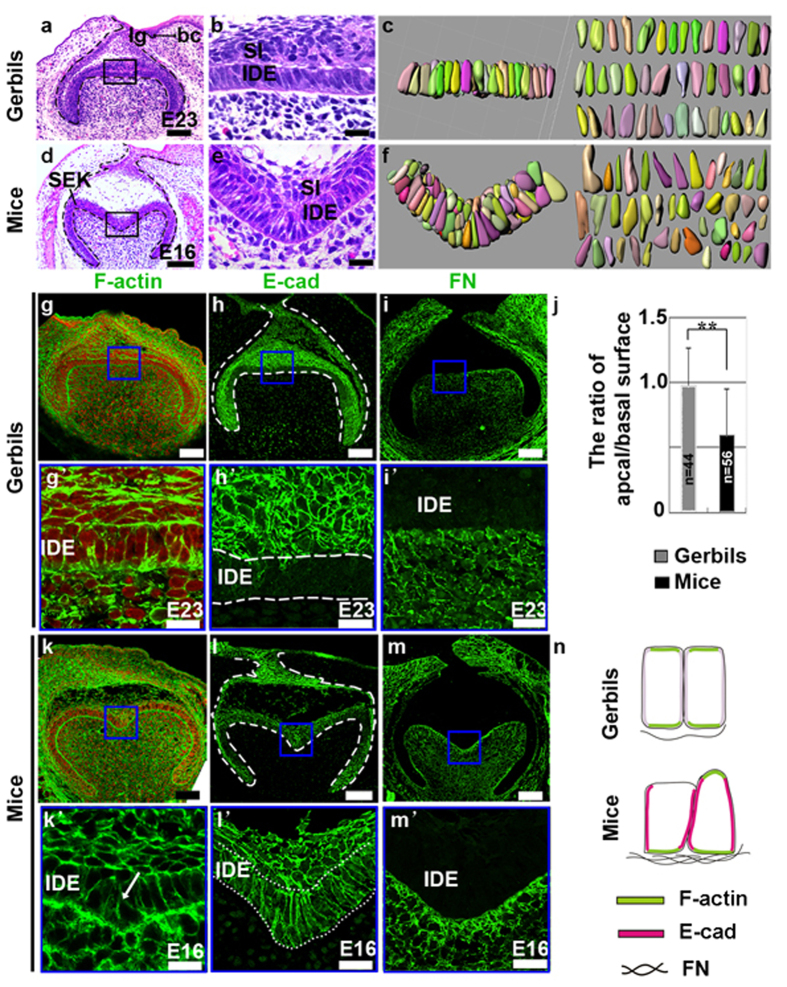
Figure 2. Comparative analysis of cellular geometry in the IDE of gerbils and mice.
(a,d) Frontal sections of the first molar at the bell stage. (b,e) High magnification images of the black boxes in (a and d) respectively. (c,f) 3D reconstructions of individual IDE cells in regions of the panels in (b and e) after staining with β-catenin to trace the cellular membranes. (j) Quantitative measurement of the apical/basal surface ratio of individual cells (**P ≤ 0.01). The error bars indicate SM. (g–i,k–m) Staining of F-actin, E-cad, FN in the tooth germ of gerbils (g–i) and mice (k–m) at the bell stage. (g’–i’,k’–m’) Higher magnification view of the IDE in the intercuspal region in mice and the equivalent region in gerbils, as indicated by the blue boxes in panels g–i,k–m. Comparative analysis of F-actin labeling in the IDE showed that F-actin was not present in the apex of IDE cells that have a wedge shape (k’; arrow). Red in (g,k and k’) indicates nuclei. (n) Schema comparing the cell shapes and localization of indicated proteins. lg, lingual; bc, buccal; IDE, inner dental epithelium; SI, stratum intermedium; SEK, secondary enamel knots. Scale bar, 100 μm (a,d,g–i,k–m), 20 μm (b,e,g’–i’,k’–m’).

