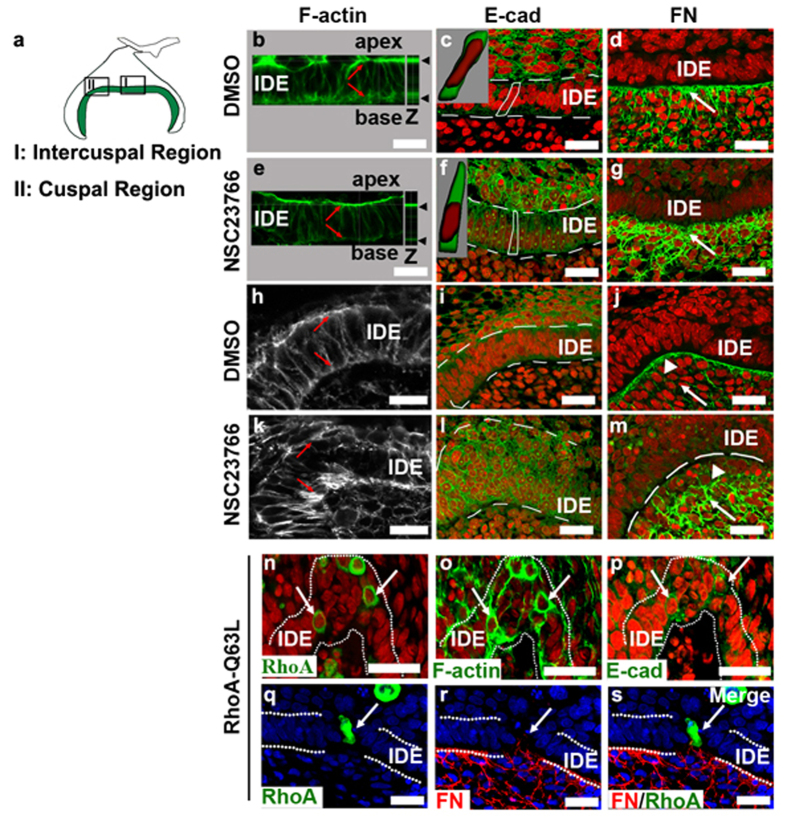
Figure 4. Remolding of the cellular geometry in the IDE cells during GTPase-mediated epithelial invagination.
(a) Schema indicates the regions of intercusps (I) and cusps (II), from which the images were taken for (b–g and h–m) respectively. (b–m) Effects of NSC23766 on F-actin, E-cad and FN in the IDE of gerbils in intercuspal regions (b–g) and in cuspal regions (h–m). Red indicates the nuclei. (b,e,h,k) Equal levels of F-actin assembled in the apex and base of IDE cells (b,h; arrows) were disrupted (e,k; arrows) after NSC23766 treatment. Z in panel b and e indicates the vertical view. (c,f,i,l) E-cad was slightly increased both in the cuspal and intercuspal regions after NSC23766 treatment. The graphic images of cytoplasm (green) and nucleus (red) inserted in panel c and f are 3D reconstructions of the outlined cells, showing the cell shapes and nuclear localization. The cells had a triangular shape in the intercuspal region and a round-compact shape in cuspal regions. (d,g,j,m) The unique assembly of FN in the basement membrane along the IDE sheet was disrupted by NSC23766. The localization of FN increased both in the intercuspal (g; arrow) and cuspal regions (m; arrow) compared with the control (d,j; arrows), but lost its assembly in the basement membrane in the cuspal regions (m; arrowhead). The formation of a pit in the IDE after several IDE cells overexpressed EGFP-RhoA-Q63L by electroporation. Green fluorescence indicates individual cells expressing RhoA-Q63L (n). RhoA-Q63L-expressing cells (n) had enhanced expression of F-actin (o) and E-cad (p) compared with neighboring cells. (q–s) FN (red) deposited around the side of RhoA-Q63L-expressing IDE cells (arrows). Blue indicates nuclei. White dashed lines outline the IDE. IDE, inner dental epithelium. Scale bar, 20 μm.

