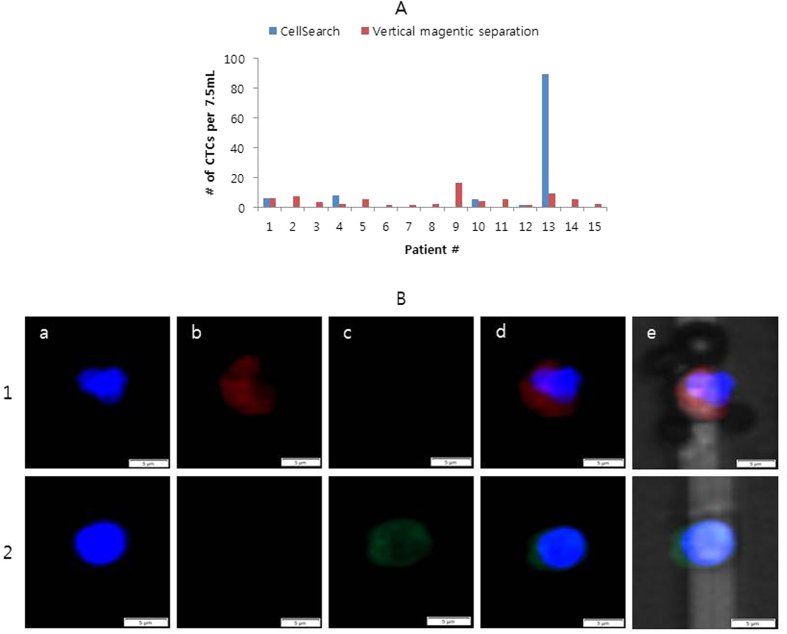
Figure 3. CTC isolation from cancer patients.
(A) Comparison of the number of CTCs isolated using the vertical magnetic separation in a well-plate and by using the CellSearch System21. (B) Stained image of CTCs (line 1) and WBC (line 2) from patient 2 using vertical magnetic separation in a well-plate. a; DAPI; b: Cytokeratin (CK); c: CD45, d: Merged image of the 3 images, e: Merged image including the bright-field image.

