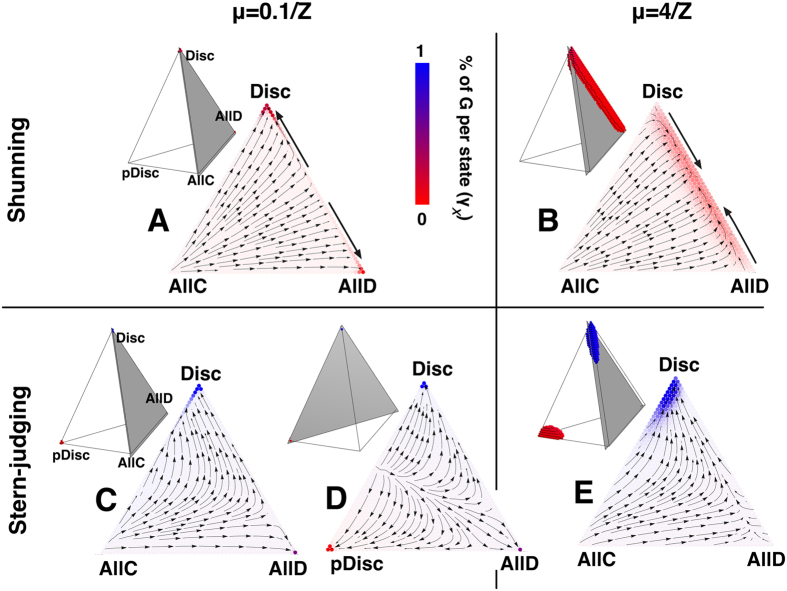
Figure 3. Dynamics of strategy adoption under Shunning (SH) and Stern-Judging (SJ).
Tetrahedrons represent the full state space (see section Methods), in which a tiny sphere (coloured given the ratio G/B) is placed in the configuration states where the population spends more time (λx), until 80% of total simulation time is covered. For convenience, the gradient of selection is visualized in the cross sections (triangles) whose location in the tetrahedron is indicated with a grey shade. Arrows represent the gradient of selection (Γx), i.e., the most likely trajectory (in configuration space) that the population will follow once at given state. The colour of the spheres (tetrahedron) and circles (triangles) reflects the blend γx Blue + (1 − γx)Red shown (where γx gives the fraction of Good individuals in each state). Both in SH (top panels, triangles A and B) and SJ (bottom panels, triangles C–E), high values of μ (right panels) slightly decrease the cooperation rate, compared to lower values of μ (left panels). Under low μ (triangles A,C,D) most of the time is spent in monomorphic states that promote cooperation (Disc for SH and SJ and also pDisc for SJ). Under high exploration rates (triangles B,E) the population is pushed away from these states, in which case cooperation is slightly affected (see Fig. 1). Other parameters (see section Methods): Z = 50, b = 5, c = 1, χ = ε = α = 0.01, τ = 1.

