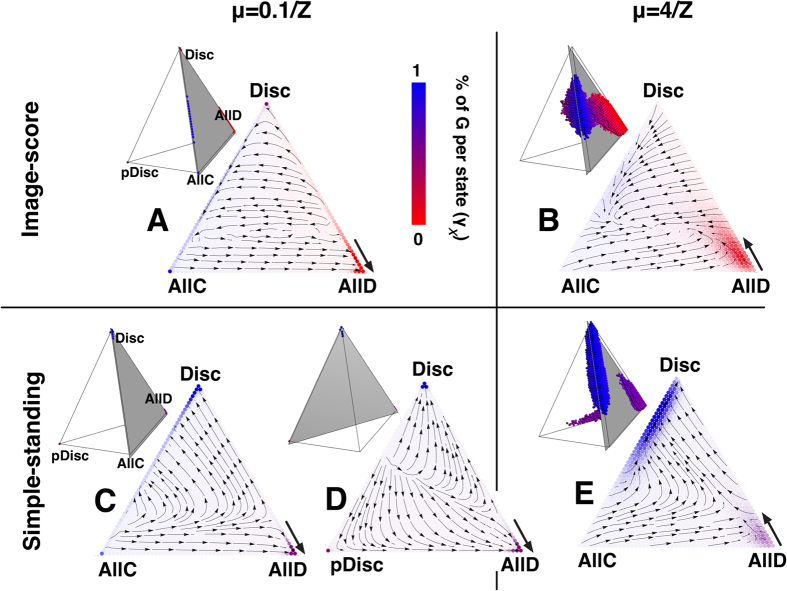
Figure 4. Dynamics of strategy adoption under Image-score (IS) and Simple-standing (SS).
We use the same notation as in Fig. 3. Both under IS (top panels, triangles A,B) and SS (bottom panels, triangles C–E), the cooperation rate increases for high μ (right panels, triangles (B,E), see also Fig. 1). For low μ (left panels, triangles A,C,D), a lot of time is spent near the monomorphic state AllD, where cooperation is absent. For high μ AllD looses stability and the population is pushed to the interior of the simplex, where it is easier to fall into configuration states with a significant number of Disc (SS, triangle E) or to incur into a cycling dynamics in the interior of the simplex (IS, triangle B). In both cases, more individuals cooperate. Other parameters (see section Methods): Z = 50, b = 5, c = 1, χ = ε = α = 0.01, τ = 1.

