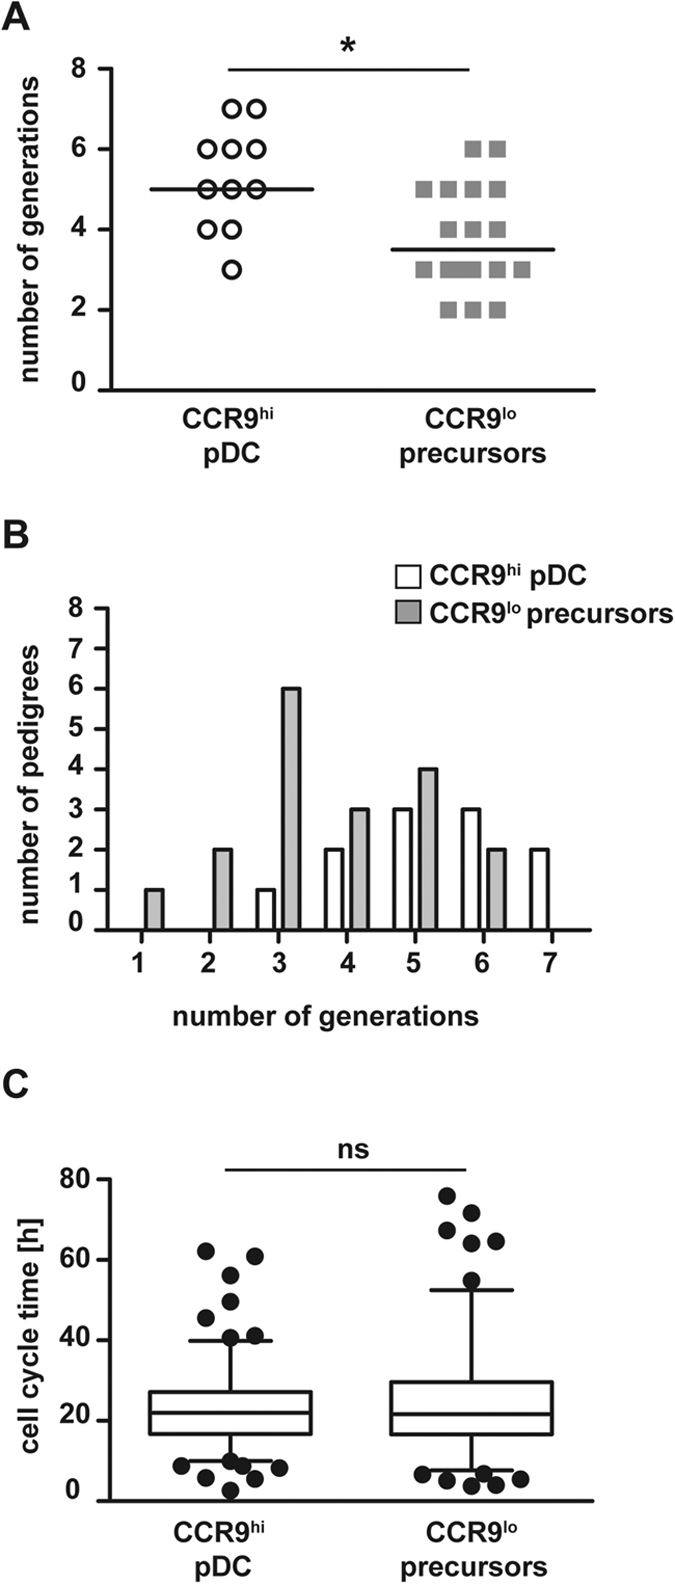
Figure 6. Number of divisions correlates with differentiation stage.

(A) CDPs were cultured on EL08 stromal cells for 5 days and progenies of the CDP were tracked continuously. Pedigrees were segregated according to their cell fates. The numbers of generations in each pedigree are shown as symbols (CCR9high pDC fate, n = 11 vs. only Siglec H+ CCR9low precursor fate, n = 18). Median numbers of generations are indicated by lines. *p = 0.0055, unpaired t-test. (B) The numbers of pedigrees with the indicated number of generations are shown for pedigrees with CCR9high pDC fate (white columns) and only Siglec H+ CCR9low precursor fate (grey columns). (C) The cell life times of all dividing cells in pedigrees with CCR9high pDC fate (n = 153 cells) and Siglec H+ CCR9low precursor fate (n = 134 cells) are shown (ns: not significant, unpaired t-test).
