
Figure 7.
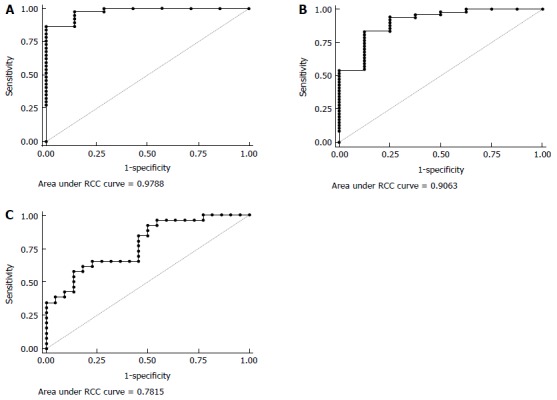
Multivariate combinations. A: Roc curve of IL2, IL4 and IL8: the best cutoff value was for a sensitivity of 100% and specificity of 71% to discriminate IBD (UC and CD) from healthy controls (AUC = 0.98, 95%CI: 0.93-1.00); B: Roc curve of MCP1, IL8 and IL10: the best cutoff value was for a sensitivity of 94% and specificity of 75% to discriminate IBD (UC and CD) from healthy controls (AUC = 0.91, 95%CI: 0.79-1.00); C: Roc curve of G-CSF, TNFα, IL4 and IL17: the best cutoff value was for a sensitivity of 92% and specificity of 50% to discriminate CD from UC (AUC = 0.78, 95%CI: 0.65-0.91).