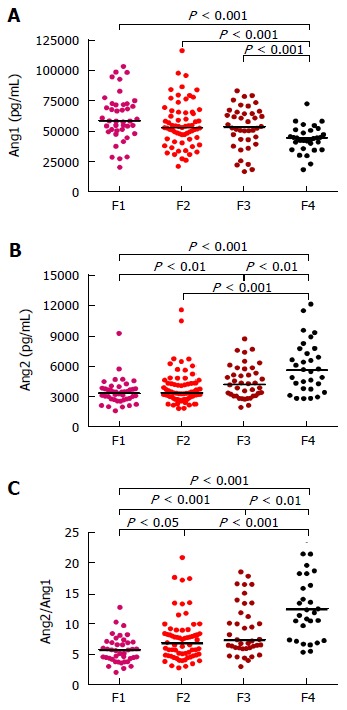
Figure 1.

Distribution serum concentrations of Ang1 (A), Ang2 (B) and Ang2/Ang1 ratio values (C) in chronic hepatitis C patients. Medians are represented by horizontal lines. Statistical significance was tested using Mann-Whitney U-test. Ang1: Angiopoietin 1; Ang2: Angiopoietin 2.
