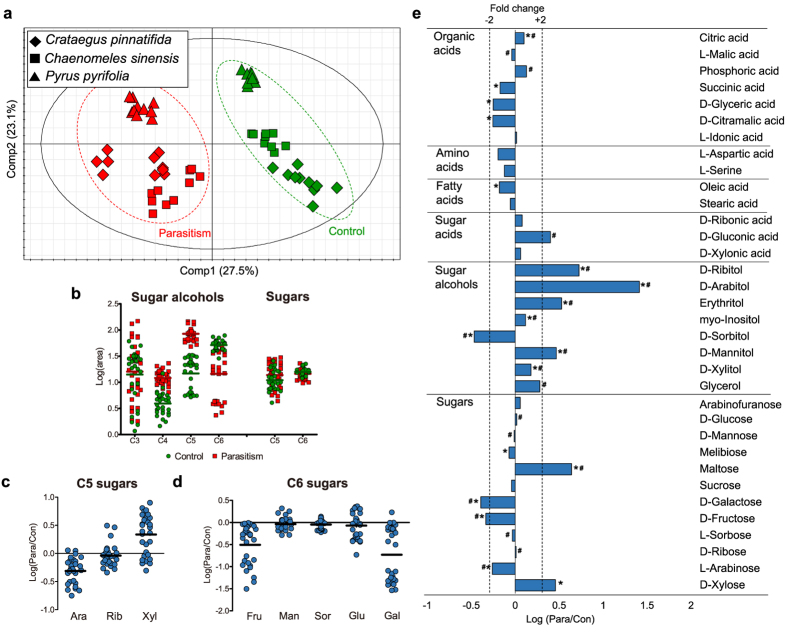
Figure 1. Control and parasitized leaves of Rosaceae differ in metabolite levels.
(a) PLS-DA score plots of CP (diamond, n = 20), CS (box, n = 20) and PS (triangle, n = 20) under the two conditions (parasitism, red; control, green) with PC1 and PC2. Validation parameters are as follows: R2X = 0.565, R2Y = 0.963 and Q2 = 0.942 (b) Scatter column plots of sugar alcohols (C3-C6) and sugars (C5-C6) in control (green) and parasitized (red) leaves divided by carbon number. (c) Scatter column plot with log-scale ratios of C5 sugars and (d) C6 sugars (the centered line represents the mean). (b–d) Sixty samples were assessed, 30 for each group. (e) Logarithmic ratios of metabolites (parasitism/control). Notable metabolites are indicated by asterisks (p-value < 0.05) and a hash sign (VIP value > 1.00) and ±2-fold change by a dashed line (n = 30 for each group).

