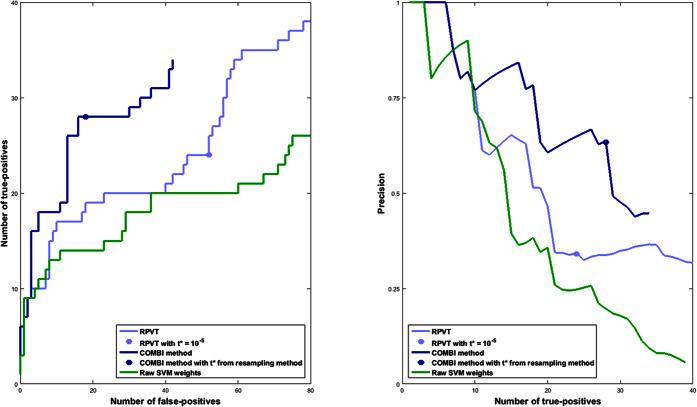
Figure 4. ROC and PR curves of the RPVT approach, the COMBI method and raw SVM weights using the independent validation pipeline as an indicator of replicability.
The results of all seven diseases have been pooled. The curves have been generated based on the replication of SNPs according to the GWAS catalog. Replicated reported associations are counted as true positives, and non-replicated associations as false positives. Note that the COMBI lines end at some point and the RPVT and the raw SVM lines continue. At the endpoint of the COMBI curve all SNPs selected in the SVM step are also significant in the statistical testing step; i.e. if one wanted to add just one more SNP to the list of reported associations, all other SNPs would also become significant, as they have a p-value of 1. The points on the RPVT and COMBI lines represent the final results of the two methods when applying the corresponding significance thresholds and are described in more detail in Table 3.

