
Fig. 4. Ligand binding and evidence for a transport pathway.
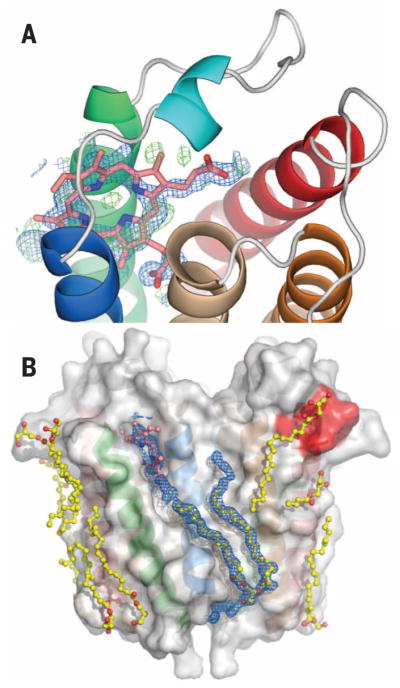
Close-up view of the porphyrin binding site (A) with a porphyrin (pink) overlaid with feature enhanced map (FEM) omit map electron density (blue) and Fo – Fc difference electron density (green), contoured at 1σ and ±3σ, respectively. A partially oxidized porphyrin is suggested by the spectrum (fig. S8A) that shows absence of a Soret band. (B) Surface groves on TSPO are occupied by monooleins and phospholipid (yellow). The CRAC site (red) is also interacting with lipids. Unusually long FEM omit map electron density (in blue and contoured at 1.0σ) extends from the porphyrin binding site to the bottom surface of the protein, beyond the bound phospholipid, suggesting an external transport pathway that involves both monomers of the dimer (see also fig. S9).