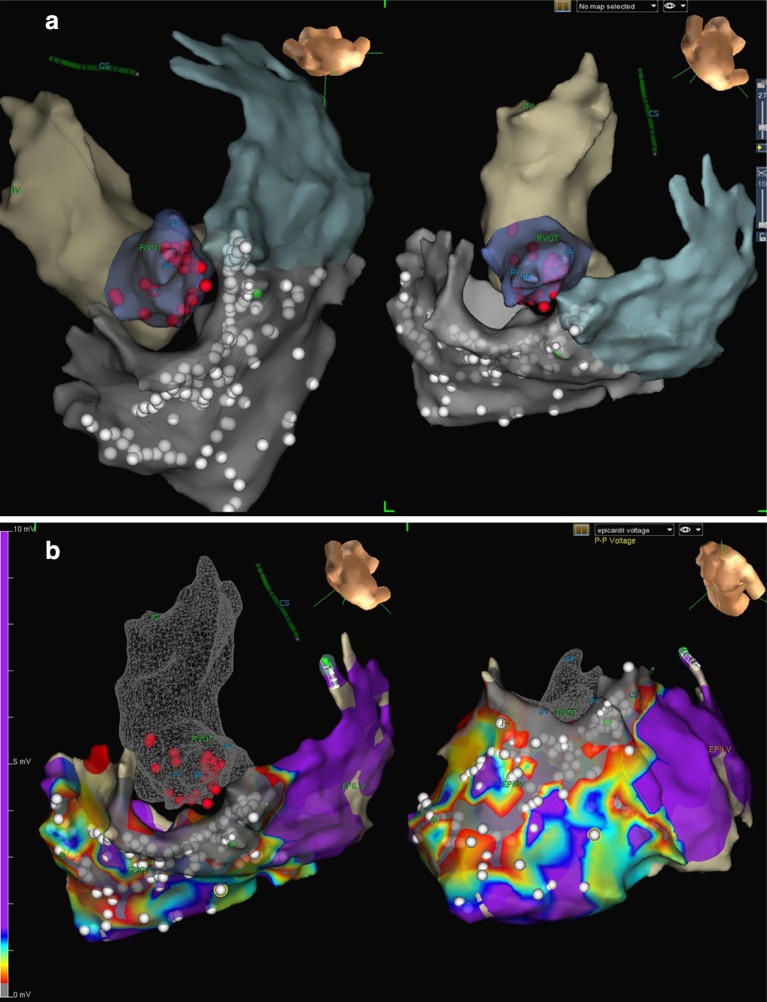
Fig. 5.
a 3-D map of the endocardial surface of the right ventricular outflow tract (RVOT) and proximal pulmonary artery (deep blue) and epicardial surfaces of the RVOT and RVOT (gray). Radiofrequency ablation using an irrigated tip catheter was performed endocardially (red dots) and epicardially (white dots). b 3-D ablation map (white dots) superimposed on the electroanatomic voltage map of the right ventricular outflow tract (RVOT) and anterior RV wall. Areas with low-voltage, late, fractionated electrograms were targeted for ablation. The endocardial ablation map (red dots) in the RVOT is also shown for reference purposes

