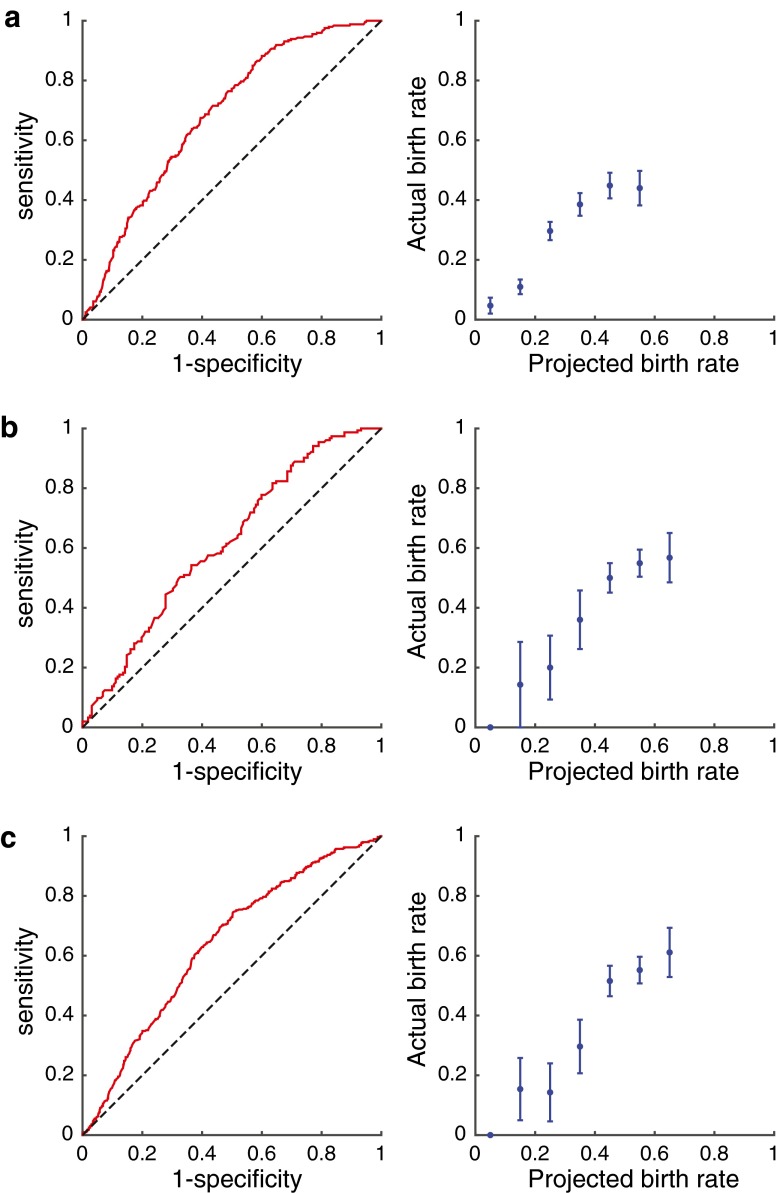
Fig. 1.
ROC curves and the projected vs. actual live birth rate for the logistic regression models. a Model for live birth following cleavage-stage ET, using only characteristics available by day 3 (Table 1A). b Model for live birth following blastocyst ET, using only characteristics available by day 3 (Table 1B). c Model for live birth following blastocyst ET, incorporating the projected numbers of embryos on day 5 (Table 1C–D), using only characteristics available by day 3

