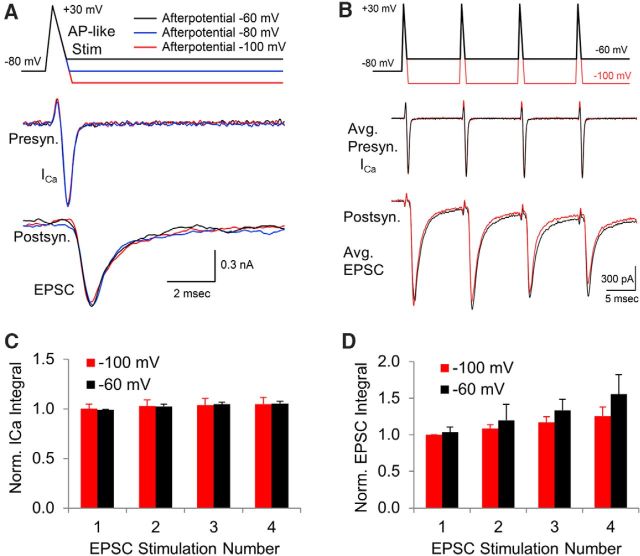
Figure 3.
Simultaneous presynaptic and postsynaptic recordings to determine whether afterpotentials after AP-like stimuli affect synaptic transmission. A, Simultaneous presynaptic and postsynaptic recordings in response to a presynaptic AP-like stimulus used to activate voltage-gated calcium channels. During the repolarization phase, the membrane potential change ended at −60 mV, −80 mV, or −100 mV to determine the response to an ADP (black), a normal response (blue) or an AHP (red), respectively. Center trace shows an overlay of the presynaptic calcium current. Bottom trace shows the EPSC in response to presynaptic afterpotentials. B, To determine whether afterpotentials affect calcium buildup between APs, we tested the presynaptic calcium channel response to a train of AP-like stimuli with an ADP (−60 mV, black) or an AHP (−100 mV, red) tested at 100 Hz while simultaneously measuring the postsynaptic responses. The postsynaptic responses to a presynaptic ADP versus an AHP showed no significant difference at each stimulation. C, Average area of the presynaptic calcium currents. Error bars indicate SEM. Responses are normalized to the first response to an AP-like stimulation with a −100 mV afterpotential. The small differences in the responses to an afterpotential at −100 mV versus −60 mV are not statistically significant (p > 0.5, t test, n = 5 paired presynaptic and postsynaptic recordings). D, Normalized area (mean, with SEM error bars) of each postsynaptic response generated by four presynaptic AP-like stimuli followed by an ADP (−60 mV, black) or an AHP (−100 mV, red) showed no significant difference at each stimulation (p > 0.2, t test, n = 5 paired presynaptic and postsynaptic recordings). EPSC integral is expressed as mean, with error bars indicating SEM.

