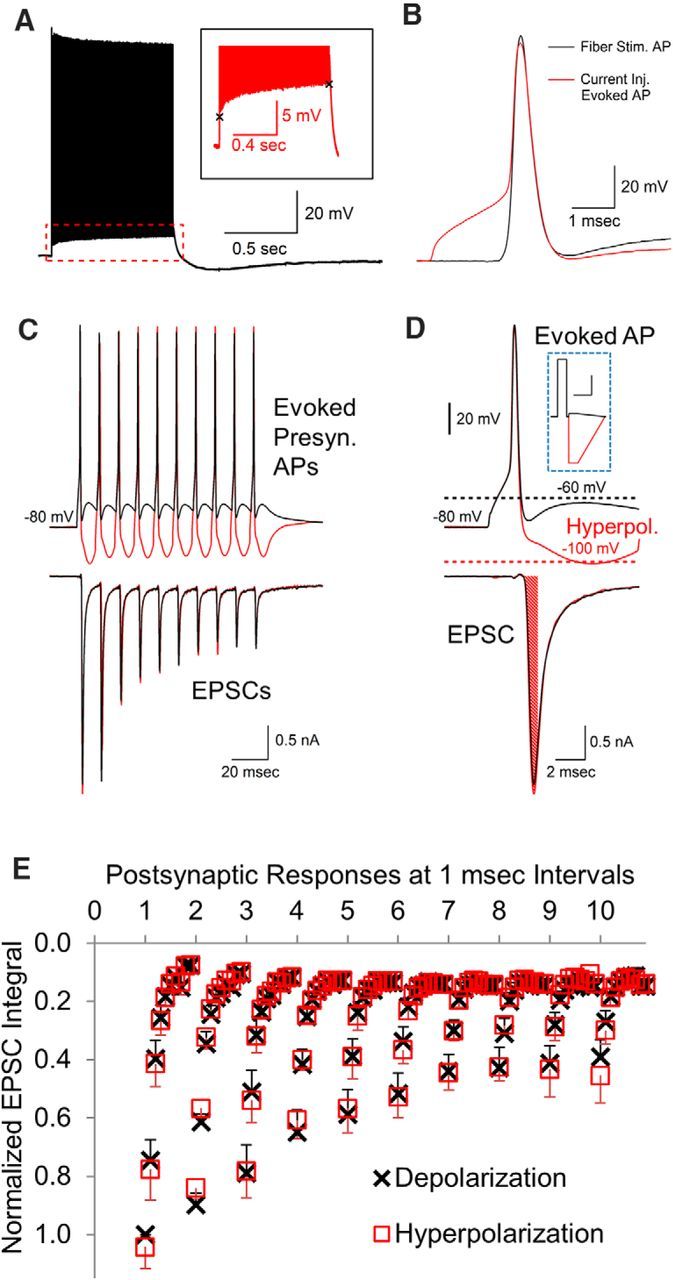
Figure 4.

Postsynaptic effects of real presynaptic APs with altered afterpotentials. A, Train of APs generated by stimulating the fiber tract at 100 Hz for 1 s showing that the response is elevated by the ADP. Inset shows an ∼5 mV change in the ADP during the 1 s stimulation period. B, Presynaptic APs generated by a brief current injection (red trace) are very similar to the APs generated by fiber stimulation (black trace). C, Presynaptic APs were generated by a brief depolarizing current injection to reach threshold, followed by a current injection to create an AHP or alter the amplitude of the ADP. D, Higher resolution of first response shown in A. The bottom trace shows an example of an area measurement over a 1 ms interval in the EPSC response. Inset shows a typical stimulus used to generate the presynaptic AP and change afterpotential levels. Inset scale bars, 4 ms, 200 pA. E, To resolve small differences throughout the response, the area of each postsynaptic response was measured in 1 ms increments for a total of 10 measurements for each postsynaptic response. The 1 ms postsynaptic area measurements (mean, with SEM error bars, n = 7) in response to presynaptic APs with an AHP versus an ADP are overlaid for comparison.
