
Figure 6.
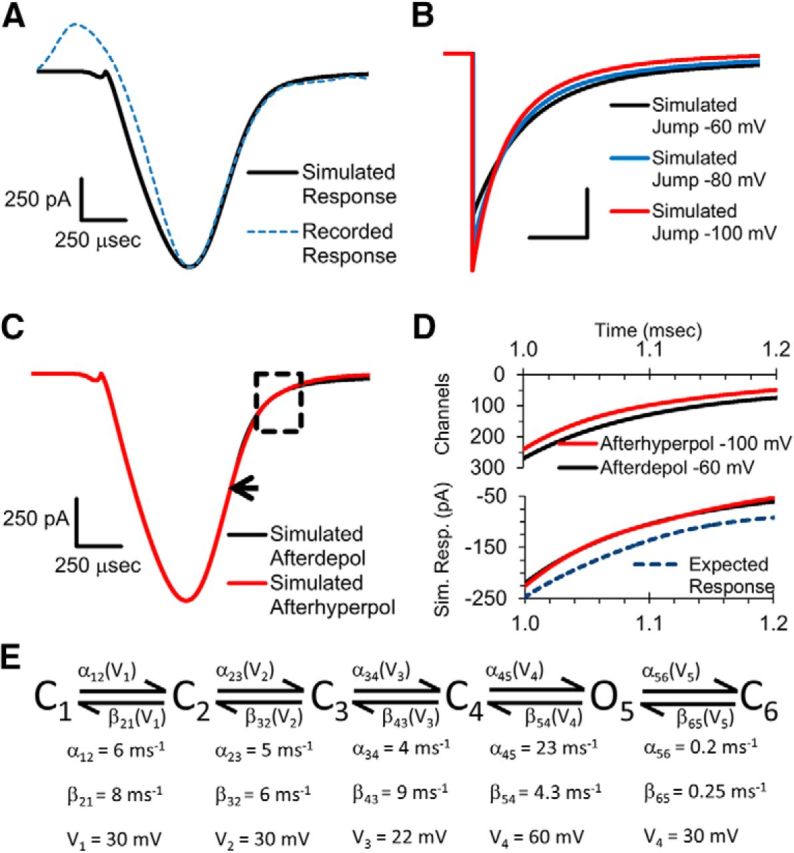
Simulations of voltage-gated calcium channel response to afterpotentials. A, Simulated response to an AP-like stimulation compared with a recorded response to an AP-like stimulation. B, Simulated response to an instant repolarization that returns to the baseline level of −80 mV (blue trace) or with an afterpotential of −60 (black trace) or −100 mV (red trace). Scale bars, 500 pA and 100 μs. C, Simulated response to an AP-like stimulation that ended in an ADP of −60 mV (black trace) or with an AHP of −100 mV. Arrow indicates where the ADP begins in the simulated response. Boxed region is centered at the beginning of the AHP. D, Simulation of the number of calcium channels that are open during the boxed region in C in response to −60 mV (black trace) or −100 mV afterpotential (red trace). Bottom shows the simulated calcium channel current during this time. Expected response is the current that would occur for the −60 mV response in the absence of the reduced electrical driving force. E, Gating scheme and the rate constants of the Markovian model used for the simulations are shown (see methods).