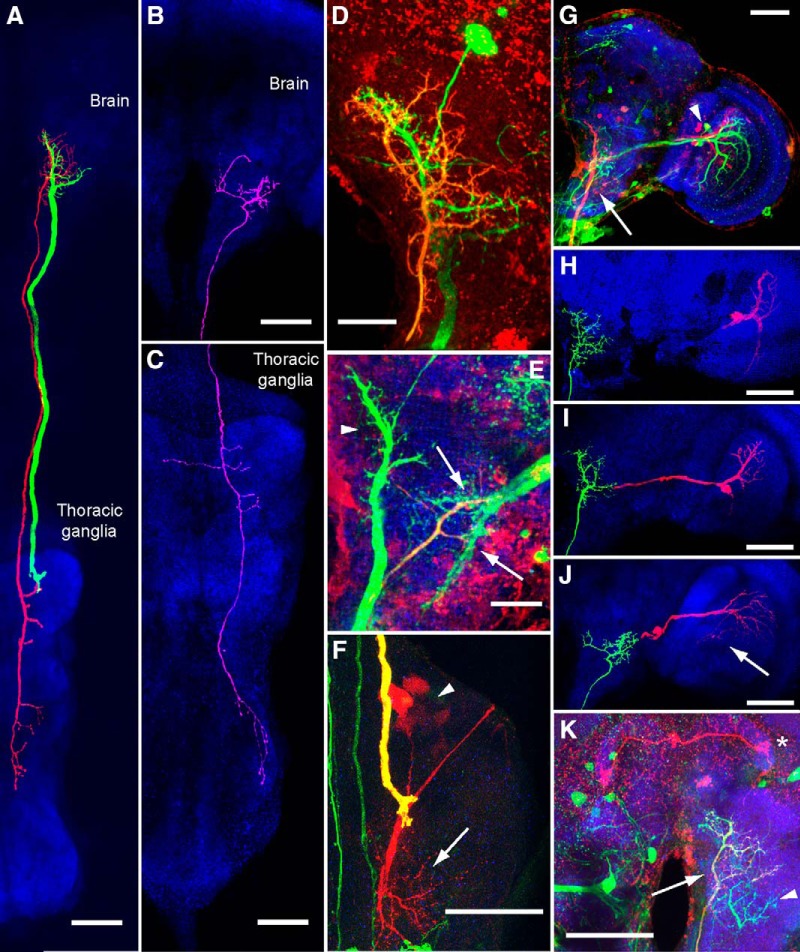
Figure 2.
Anatomy of the descending neurons and gap junction-coupled synaptic partners. A, DNOVS1 (green) and DNOVS2 (red) are traced in the same brain and shown with an anti-nc82 neuropil stain (blue). We traced GFP expression in DNOVS1 and an intracellular fill in DNOVS2 (biocytin later conjugated to an Alexa Fluor dye). The neuropil signal is a maximum-intensity projection. B, DNHS1 (pink) was traced using an intracellular fill and is shown against a neuropil stain in the same brain (blue). C, Processes of DNHS1 traced in the thoracic ganglia indicate putative output processes in neck and haltere motor regions. D, Magnified maximum intensity projection of DNOVS1 and DNOVS2 processes in the brain. GFP expression in DNOVS1 appears green. The processes of DNOVS2, which are also labeled by GFP, are also labeled with an Alexa Fluor dye conjugated to biocytin (red; overlap appears yellow-orange). The cell body of DNOVS2 was extracted during removal of the recording electrode, but that of DNOVS1 remains. E, DNHS1 processes overlap with HS terminals (arrows). DNHS1 and HS cells express GFP (green) and DNHS1 is also labeled with an intracellular biocytin fill (red; overlap appears yellow-orange). DNOVS1 is also labeled by this driver line and appears in this image (arrowhead). F, DNOVS1 output terminals in the neck motor region. DNOVS1 is labeled both by GFP (green) and an intracellular dye fill (red) and appears yellow. Dye-coupled synaptic partners with DNOVS1, the frontal neck motor neurons, appear in red (dendrites are indicated by the arrow and cell bodies by the arrowhead). G, DNOVS1 and dye-coupled synaptic partners VS cells 4–6 are labeled with a biocytin fill (red). DNOVS1's axon is indicated by the arrow and cell bodies of VS 4–6 by the arrowhead. GFP expression is shown in green and anti-nc82 neuropil stain is in blue. VS 1–3 are not dye coupled to DNOVS1, but are also labeled by this Gal4-driver line (green) and appear next to the red VS 4–6 cell dendrites. H, DNOVS2 (green) is dye coupled to VS2 (red). Both neurons were traced using the same biocytin stain after filling DNOVS2, but are colored differently. Neuropil appears blue. I, DNOVS2 (green) is dye coupled to VS3 (red). Neuropil appears blue. J, DNHS1 (green) is dye coupled to HSN and HSE (red; HSE is faintly filled in this image and marked with an arrow). Neuropil stain appears blue. K, DNOVS2 (axon indicated by arrow) is labeled by GFP (green) and filled with biocytin (red signal; overlap with GFP signal results in yellow appearance of DNOVS2). A dye-coupled neuron in the protocerebral bridge appears red (asterisk). DNHS1 is also labeled by GFP in this driver line (green; arrowhead). Scale bars in D and E are 20 μm; all others are 50 μm. We used the following driver lines to label neurons in this figure: for A, D, and K: 94H09-Gal4; for B, C, and F: R15C02-Gal4; and for E and G: R20C05-Gal4. In all figures, the brain is oriented so anterior is upward.

