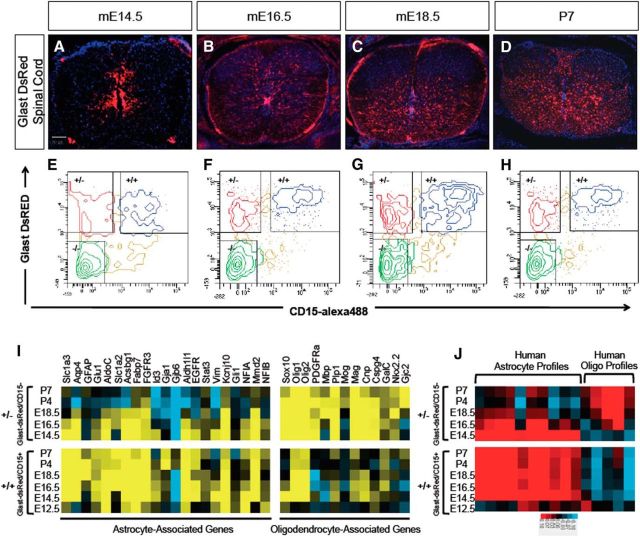
Figure 1.
Isolation and expression profiling of Glast-dsRed populations. A–D, Glast-dsRed expression in the developing spinal cord. E–H, FACS plots showing prospective isolation of Glast-dsRed/CD15+ (+/+) and Glast-dsRed/Cd15− (+/−) populations across the E14.5–P7 interval. I, Heatmap analysis demonstrating expression of established astrocyte and oligodendrocyte lineage genes in the +/+ and +/− populations. J, Heat map showing intersample Pearson's correlations (red, positive; bright red or blue denotes r value >0.1 or <−0.1, respectively) between microarray profiles of Glast-dsRed populations and mRNA-Seq profiles from independent gene expression samples of human astrocytes and oligodendrocytes (Zhang et al., 2014).

