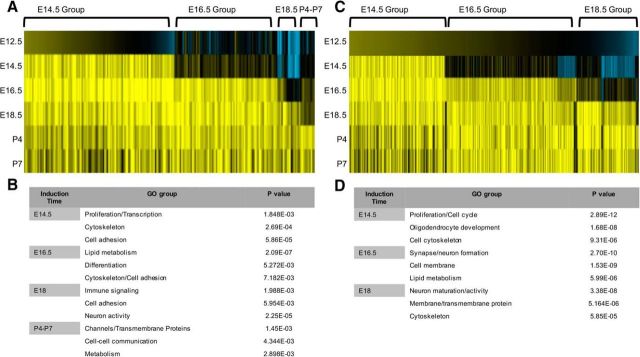
Figure 2.
Identification of gene induction groups in astrocyte precursors. A, Heatmap analysis of the gene-expression changes across the E12.5–P7 interval in the +/+ populations. B, Gene ontology analysis of each induction group and the associated p values for gene sets associated with a given ontology in the +/+ populations. C, Heatmap analysis of the gene-expression changes across the E12.5–P7 interval in the +/− populations. D, Gene ontology analysis of each induction group and the associated p values for gene sets associated with a given ontology in the +/− populations.

