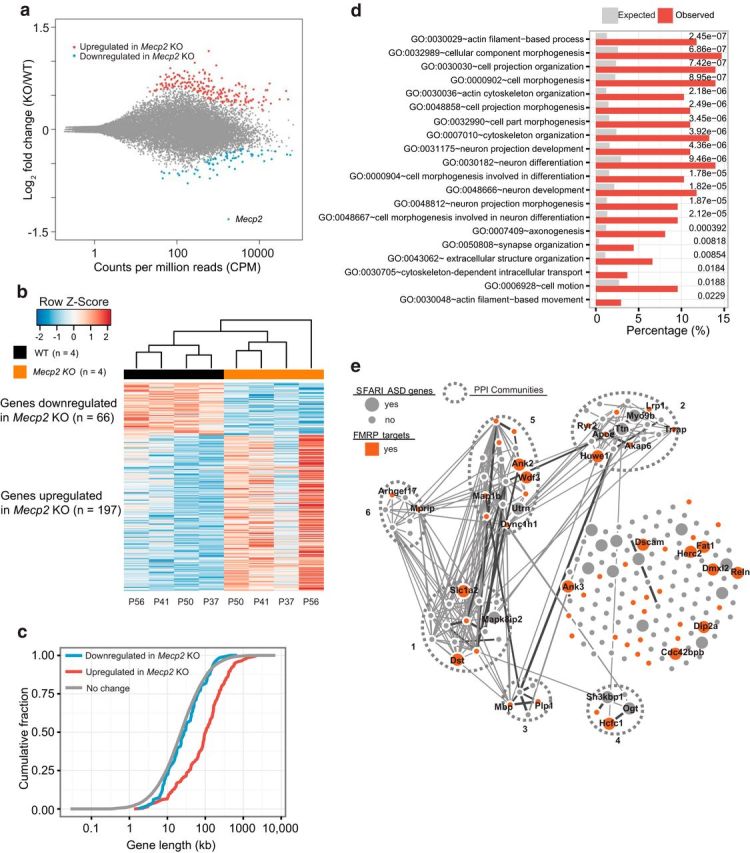
Figure 3.

Analysis of MeCP2-regulated ribosome-associated mRNAs in hippocampal CA1 neurons. a, MA plot (DESeq2) showing log2-fold changes between Mecp2 KO/WT over the mean of normalized transcript counts. TRAP-seq analyzed translating mRNAs isolated from hippocampal CA1 neurons in WT Cck bacTRAP mice (n = 4) and Mecp2 KO Cck-bacTRAP mice (n = 4). Red dots represent transcripts that were significantly upregulated in Mecp2 KO (n = 197, false discovery rate [FDR] = 0.1) and blue dots represent transcripts that were significantly downregulated in Mecp2 KO (n = 66, FDR = 0.1). Gray dots represent transcripts not significantly altered. The data point corresponding to the Mecp2 mRNA is indicated. b, Heat map of transcripts that are significantly differentially expressed between WT and Mecp2 KO. Each column represents one biological replicate (animal) (FDR < 0.1) with age marked at the bottom. c, Cumulative distribution of gene lengths for genes upregulated in Mecp2 KO (red), genes downregulated in Mecp2 KO (blue), and all the unaltered genes detected in hippocampal CA1 neurons (gray). Two-sample KS test: upregulated versus no change, p = 4.6 × 10⁻³⁴; downregulated versus no change, p = 0.21. d, Functional annotation analysis of genes upregulated in Mecp2 KO using DAVID Bioinformatics Resources 6.7 (National Institute of Allergy and Infectious Diseases–National Institutes of Health). The top 20 enriched GO terms with p < 0.05 (corrected for multiple comparisons by Benjamin adjustment) are shown with expected (gray bars) and observed (red bars) percentages of genome. e, PPI network analysis of 197 genes upregulated in Mecp2 KO generated by the GeNets algorithm using the InWeb PPI database (https://www.broadinstitute.org/genets). Curated and computationally derived PPIs are shown as lines. Line thickness reflects the level of confidence in the interaction. Sets of genes more connected with each other than to other groups of genes are defined as PPI communities and are enclosed by the ovals bounded by dashed lines. Genes without known PPI are arrayed to the right side. This analysis identified six distinct PPI communities within 197 MeCP2-repressed genes. Each community gene list is submitted to DAVID functional annotation tool. Community 1 is enriched for actin cytoskeleton and neuron projection. Community 5 is enriched for actin binding, cell junction, and synapse. In addition, genes that are identified as SFARI ASD genes (https://gene.sfari.org/autdb/HG_Home.do) are highlighted as larger nodes, whereas those overlapping with FMRP-bound targets are highlighted in red. Gene names are indicated for those that are identified as SFARI ASD genes and/ or FMRP targets.
