Figure 4.

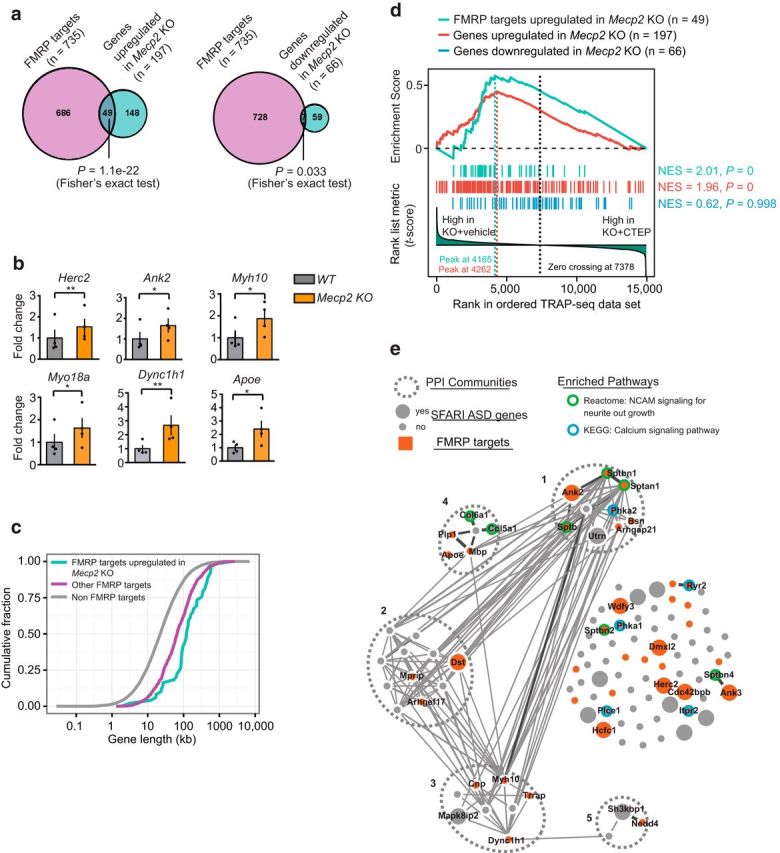
Genes upregulated in Mecp2 KO have a significant overlap with FMRP direct mRNA targets. The list of FMRP directly associated mRNAs from the mouse brain tissue is from published datasets (Darnell et al., 2011). a, Venn diagrams showing a significant overlap between FMRP direct mRNA targets and mRNAs upregulated in Mecp2 KO (Fisher's exact test, p = 1.1 × 10⁻²²) and a fewer number of genes overlapping between FMRP direct targets and mRNAs downregulated in Mecp2 KO (Fisher's exact test p = 0.033). b, Validation of TRAP-seq identified target genes that were shared between genes upregulated in Mecp2 KO and FMRP direct mRNA targets by qPCR. Two-tailed paired t tests: Herc2 p = 0.0099 **, Ank2 p = 0.0296 *, Myh10 p = 0.0335 *, Apoe p = 0.0117 *, Myo18a p = 0.02 *, Dync1h1 p = 0.0039 **, n = 4 animals. c, Cumulative distribution of gene lengths for FMRP targets upregulated in Mecp2 KO (cyan), other FMRP direct targets (magenta), and the rest of mRNAs that are non-FMRP targets (gray). Two-sample KS test: FMRP targets upregulated in Mecp2 KO versus other FMRP targets p = 6.3 × 10⁻⁵, other FMRP targets versus non-FMRP targets p = 1.2 × 10−67. d, GSEA of genes upregulated in Mecp2 KO (red vertical bars, n = 197), upregulated in Mecp2 KO/FMRP-bound mRNAs (cyan vertical bars, n = 49), or genes downregulated in Mecp2 KO (blue vertical bars, n = 66 genes) on a ranked list of genes differentially expressed between vehicle-treated and CTEP-treated Mecp2 KO hippocampal CA1 neurons. Genes that are relatively downregulated in CTEP-treated Mecp2 KO are displayed on the left side of the plot. The red and cyan line in the upper part of the plot indicates the GSEA enrichment running scores for the list of genes upregulated or downregulated in Mecp2 KO, respectively. The vertical dash lines indicate the peaks corresponding to enrichment score (ES). e, PPI network analysis of a subset of genes upregulated in Mecp2 KO that are downregulated by the CTEP treatment (n = 108 leading edge genes). This analysis identified five distinct PPI communities. In addition, genes that are identified as SFARI ASD genes are highlighted as larger nodes, whereas those overlapping with FMRP-bound targets are highlighted in red. Genes significantly enriched in two functionally relevant pathways are labeled with green outer-circle (NCAM signaling for neurite out growth, adjusted-p = 5.8 × 10⁻⁷) or blue outer-circle (Calcium signaling pathway, adjusted-p = 1.7 × 10⁻²), respectively. Gene names are indicated for those that are enriched in the two pathways.
