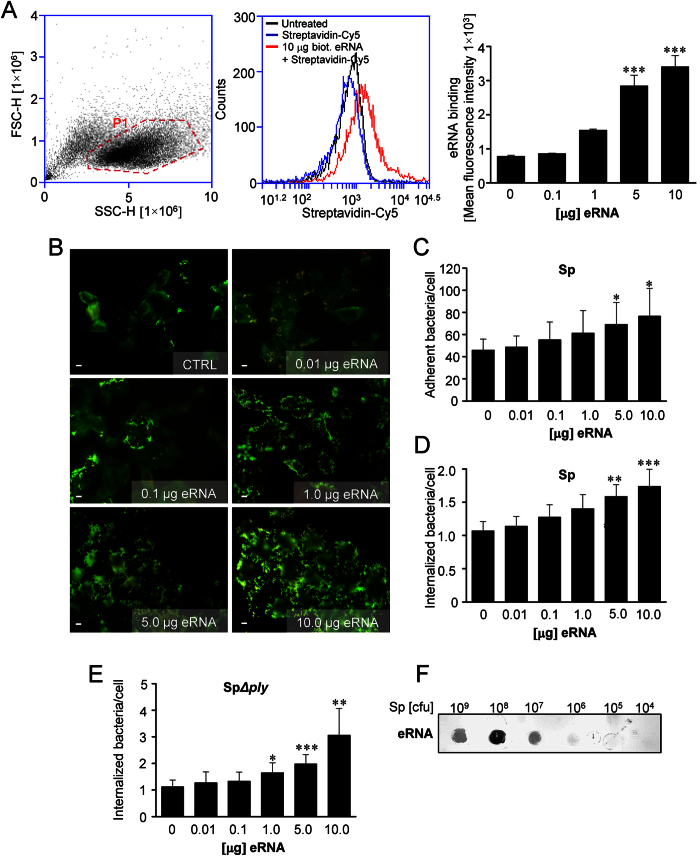
Figure 1. Pneumococcal infection is attenuated in the presence of eRNA.
(A) A549 cells were incubated with different concentrations of biotinylated eRNA. After eRNA treatment cells were analysed by flow cytometry. Gate based on forward and side scatter was set to eliminate cellular debris and cell clusters (left panel). The binding of eRNA to cell membrane was analyzed in the Cy5 channel of the flow cytometer. Histogram overlay illustrates control cells (black), and cells incubated with 10 μg biotinylated eRNA (red) or Cy5-conjugated Streptavidin (blue; middle panel). Dose-dependent binding of eRNA to A549 cells analyzed by flow cytometry (right panel). Data represent mean values (±SEM). n = 4, ***p ≤ 0.001 vs control (Ctrl). (B) Human lung pneumocytes A549 were preincubated with different doses of eRNA (0.01–10 μg) and pneumococcal host-cell adherence and internalization of serotype 2 S. pneumoniae (Sp)-strain (ATCC11733) were measured by immunofluorescence staining and microscopy. The staining procedure resulted in Alexa568-labeled intracellular bacteria (red fluorescence) and Alexa488/568-labeled extracellular pneumococci (green/yellow). Scale bars in the images represent 10 μm. (C) Quantification of pneumococcal adherence to A549 cells after treatment with different doses of eRNA. Data represent mean values ± SEM; n = 3; *p ≤ 0.05. (D) Quantification of pneumococcal internalization into A549 cells after eRNA treatment. Data represent mean values ± SEM; n = 3; **p ≤ 0.01; ***p ≤ 0.001. (E) The internalization of S. pneumoniae pneumolysin-deficient strain (SpΔply) into A549 cells measured by antibiotic protection assay. Data represent mean values ± SD; n = 3; *p ≤ 0.05, **p ≤ 0.01; ***p ≤ 0.001. (F) Different amounts of S. pneumoniae (104, 105, 106, 107, 108 and 109 cfu) were immobilized on the nitrocellulose membrane. The binding of biotinylated eRNA to bacteria was detected using peroxidase-coupled streptavidin.

