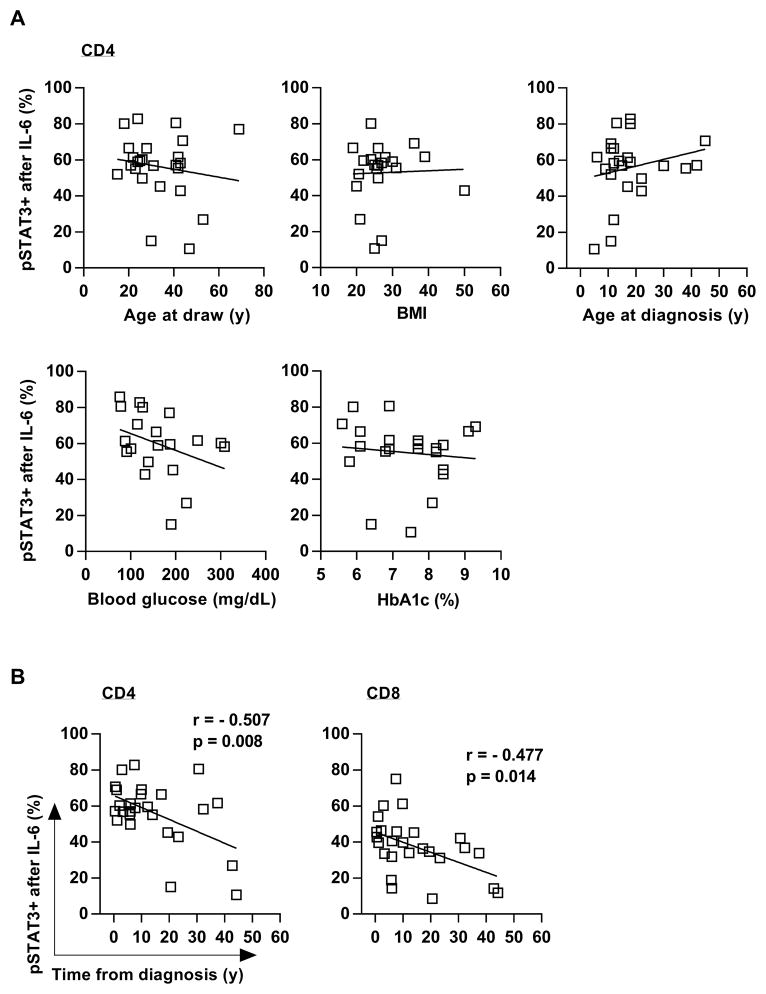
Figure 2. T cell responses to IL-6 decrease with time from diagnosis.
(A) Linear regression showing that IL-6-induced pSTAT3 is independent from age at draw, BMI, age at diagnosis, blood glucose levels, and glycated hemoglobin (HbA1c). (B) Linear regression showing the inverse correlation between time from diagnosis (disease duration) and IL-6/pSTAT3 in CD4 and CD8 T cells from subjects with T1D (left and right panels, respectively); 21≤ n ≤29 (A) and n = 26 (B) ; r = Pearson correlation coefficient.

