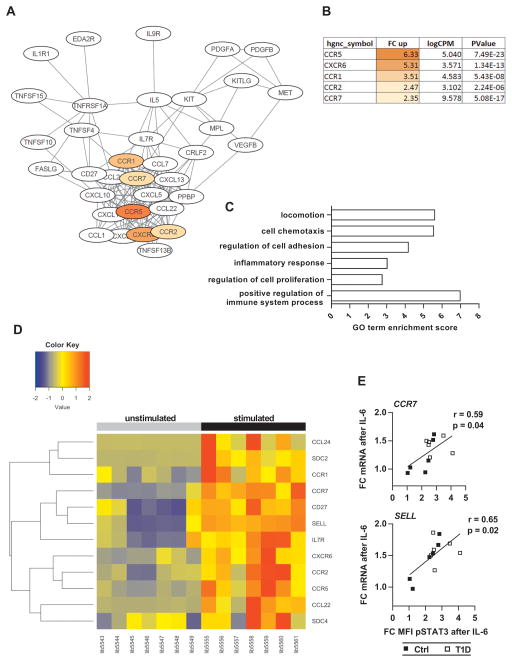
Figure 5. Transcriptome analysis of IL-6 treated CD4+CD25− T cells from patients with T1D.
(A) Network of enriched KEGG pathway cytokine- cytokine receptor interaction illustrates cluster of IL-6-induced genes involved in T cell trafficking. Chemokine receptors are shown in color. (B) Fold change up-regulation, expression level (logCPM) and P value of the chemokine receptors identified in (A). (C) GO analysis of IL-6-induced genes shows enrichment of terms associated with cell migration and regulation of inflammatory responses. (D) Heat map of immune-relevant genes demonstrating consistent up-regulation by IL-6 across subjects. (Left) Unstimulated cells. (Right) IL-6-stimulated cells from the same subjects. (E) Linear regression showing positive correlation between IL-6/pSTAT3 and expression level of CCR7 and SELL in CD3+ T cells; n = 6 (Ctrl) and n = 6 (T1D). r = Pearson correlation coefficient.

