
Figure 2.
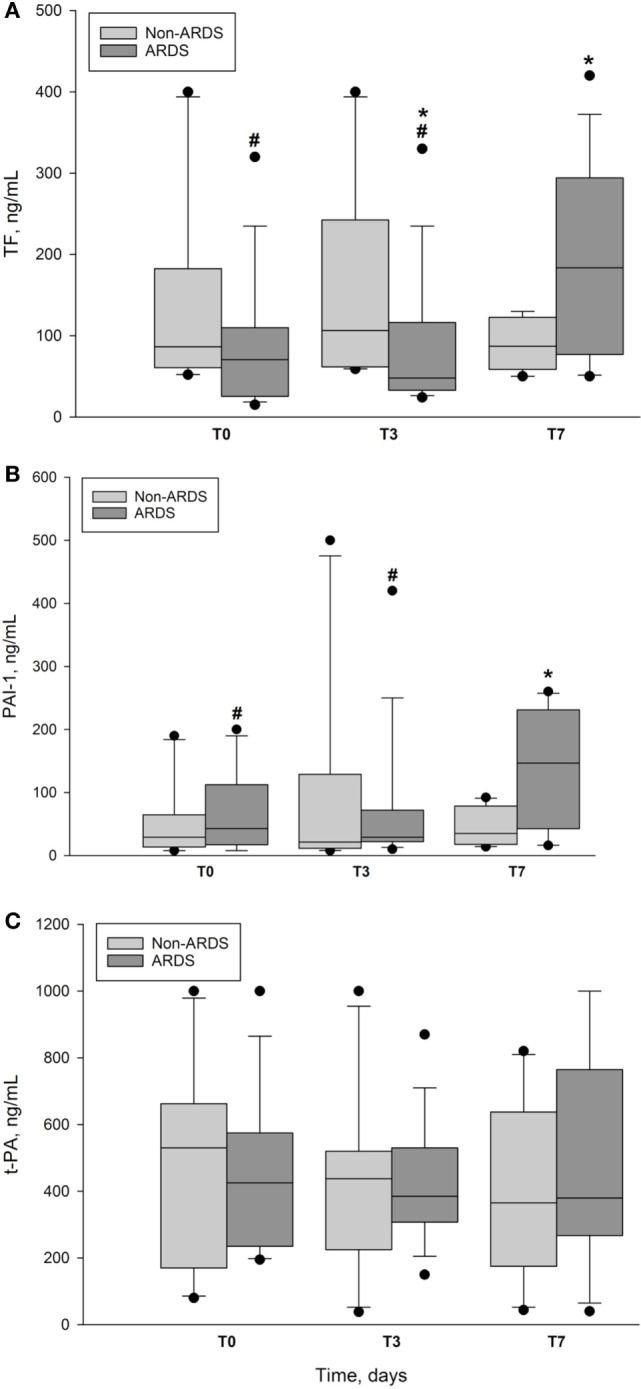
Plasma concentrations of markers of coagulation and fibrinolysis in ARDS and non-ARDS patients. (A) Plasma concentration of tissue factor (TF) vs. time in ARDS group and non-ARDS group. Data presented as median and interquartile range with 10th and 90th percentiles error bars. T0 is day of enrollment, T3 and T7, the third day and the seventh day of ICU stay. *denotes intergroup p = 0.043 at T3 and p = 0.022 at T7. #denotes ARDS intragroup p ≤ 0.001 between T7 and T0 and T3, respectively. pg/ml, picogram per milliliter; closed circles represent outliers. (B) Plasma concentrations of plasminogen activator inhibitor-1 (PAI-1) vs. time in ARDS group and non-ARDS group. Data presented as median and interquartile range with 10th and 90th percentiles error bars. T0 is day of enrollment, T3 and T7, the third day and the seventh day of ICU stay. *denotes intergroup p = 0.026 at T7. #denotes ARDS intragroup p = 0.016 between T7 and T0 and p = 0.017 between T7 and T3. pg/ml, picogram per milliliter; closed circles represent outliers. (C) Plasma concentration of tissue plasminogen activator (t-PA) vs. time in ARDS group and non-ARDS group. Data presented as median and interquartile range with 10th and 90th percentiles error bars. T0 is day of enrollment, T3 and T7, the third day and the seventh day of ICU stay. No significant intergroup or intragroup differences; closed circles represent outliers.