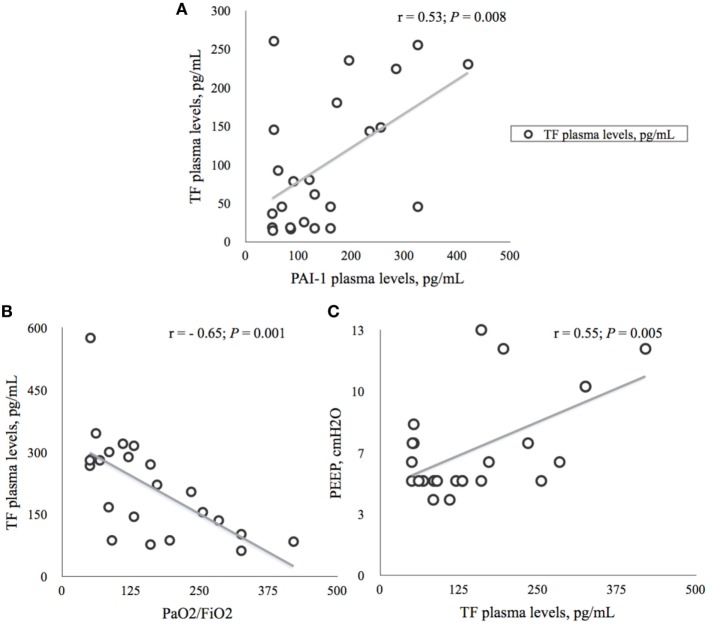
Figure 3.
Correlations between tissue factor (TF) and plasminogen activator inhibitor-1 (AI-1) and ventilation parameters on the seventh day (T7) of ICU stay. (A) Relationship between plasma concentrations of TF and PAI-1 in 24 ICU patients. Data presented as Spearman’s correlation coefficient (r) with p-value. TF, tissue factor; PAI-1, plasminogen activator inhibitor; pg/ml, picogram per milliliter. (B). Relationship between plasma concentrations of TF and PaO2/FiO2 in 24 ICU patients. Data presented as Spearman’s correlation coefficient (r) with p-value. PaO2, arterial oxygen partial pressure; FiO2, fraction of inspired oxygen; TF, tissue factor; pg/ml, picogram per milliliter. (C) Relationship between plasma concentrations of TF and level of PEEP in 24 ICU patients. Data presented as Spearman’s correlation coefficient with p-value. PEEP, positive end-expiratory pressure; cmH2O, centimeter of water; TF, tissue factor; pg/ml, picogram per milliliter.

